Activity Based Intelligence Principles and Applications
ABI represents a fundamentally different way of doing intelligence analysis, one that is important in its own terms but that also offers the promise of creatively disrupting what is by now a pretty tired paradigm for thinking about the intelligence process.
ABI enables discovery as a core principle. Discovery—how to do it and what it means—is an exciting challenge, one that the intelligence community is only beginning to confront, and so this book is especially timely.
The prevailing intelligence paradigm is still very linear when the world is not: Set requirements, collect against those requirements, then analyze. Or as one wag put it: “Record, write, print, repeat.”
ABI disrupts that linear collection, exploitation, dissemination cycle of intelligence. It is focused on combining data—any data—where it is found. It does not prize data from secret sources but combines unstructured text, geospatial data, and sensor-collected intelligence. It marked an important passage in intelligence fusion and was the first manual evolution of “big data” analysis by real practitioners. ABI’s initial focus on counterterrorism impelled it to develop patterns of life on individuals by correlating their activities, or events and transactions in time and space.
ABI is based on four fundamental pillars that are distinctly different from other intelligence methods. The first is georeference to discover. Sometimes the only thing data has in common is time and location, but that can be enough to enable discovery of important correlations, not just reporting what happened. The second is sequence neutrality: We may find a critical puzzle piece before we know there is a puzzle. Think how often that occurs in daily life, when you don’t really realize you were puzzled by something until you see the answer.
The third principle is data neutrality. Data is data, and there is no bias toward classified secrets. ABI does not prize exquisite data from intelligence sources over other sources the way that the traditional paradigm does. The fourth principle comes full circle to the first: integrate before exploitation. The data is integrated in time and location so it can be discovered, but that integration happens before any analyst turns to the data.
ABI necessarily has pushed advances in dealing with “big data,” enabling technologies that automate manual workflows, thus letting analysts do what they do best. In particular, to be discoverable, the metadata, like time and location, have to be normalized. That requires techniques for filtering metadata and drawing correlations. It also requires new techniques for visualization, especially geospatial visualization, as well as tools for geotemporal pattern analysis. Automated activity extraction increases the volume of georeferenced data available for analysis.
ABI is also enabled by new algorithms for correlation and fusion, including rapidly evolving advanced modelingand machine learning techniques.
ABI came of age in the fight against terror, but it is an intelligence method that can be extended to other problems—especially those that require identifying the bad guys among the good in areas like counternarcotics or maritime domain awareness. Beyond that, ABI’s emphasis on correlation instead of causation can disrupt all-too-comfortable assumptions. Sure, analysts will find lots of spurious correlations, but they will also find intriguing connections in interesting places, not full-blown warnings but, rather, hints about where to look and new connections to explore.
This textbook describes a revolutionary intelligence analysis methodology using approved, open-source, or commercial examples to introduce the student to the basic principles and applications of activity-based intelligence (ABI).
Preface
Writing about a new field, under the best of circumstances, is a difficult endeavor. This is doubly true when writing about the field of intelligence, which by its nature must operate in the shadows, hidden from the public view. Developments in intelligence, particularly in analytic tradecraft, are veiled in secrecy in order to protect sources and methods;
Activity-Based Intelligence: Principles and Applications is aimed at students of intelligence studies, entry-level analysts, technologists, and senior-level policy makers and executives who need a basic primer on this emergent series of methods. This text is authoritative in the sense that it documents, for the first time, an entire series of difficult concepts and processes used by analysts during the wars in Iraq and Afghanistan to great effect. It also summarizes basic enabling techniques, technologies, and methodologies that have become associated with ABI.
1
Introduction and Motivation
By mid 2014, the community was once again at a crossroads: the dawn of the fourth age of intelligence. This era is dominated by diverse threats, increasing change, and increasing rates of change. This change also includes an explosion of information technology and a convergence of telecommunications, location-aware services, and the Internet with the rise of global mobile computing. Tradecraft for intelligence integration and multi-INT dominates the intelligence profession. New analytic methods for “big data” analysis have been implemented to address the tremendous increase in the volume, velocity, and variety of data sources that must be rapidly and confidently integrated to understand increasingly dynamic and complex situations. Decision makers in an era of streaming real-time information are placing increasing demands on intelligence professionals to anticipate what may happen…against an increasing range of threats amidst an era of declining resources. This textbook is an introduction to the methods and techniques for this new age of intelligence. It leverages what we learned in the previous ages and introduces integrative approaches to information exploitation to improve decision advantage against emergent and evolving threats.
Dynamic Change and Diverse Threats
Transnational criminal organizations, terrorist groups, cyberactors, counterfeiters, and drug lords increasingly blend together; multipolar statecraft is being rapidly replaced by groupcraft.
The impact of this dynamism is dramatic. In the Cold War, intelligence focused on a single nation-state threat coming from a known location. During the Global War on Terror, the community aligned against a general class of threat coming from several known locations, albeit with ambiguous tactics and methods. The fourth age is characterized by increasingly asymmetric, unconventional, unpredictable, proliferating threats menacing and penetrating from multiple vectors, even from within. Gaining a strategic advantage against these diverse threats requires a new approach to collecting and analyzing information.
1.1.2 The Convergence of Technology and the Dawn of Big Data
Information processing and intelligence capabilities are becoming democratized.
In addition to rapidly proliferating intelligence collection capabilities, the fourth age of intelligence coincided with the introduction of the term “big data.” Big data refers to high-volume, high-velocity data that is difficult to process, store, and analyze with traditional information architectures. It is thought that the term was first used in an August 1999 article in Communications of the ACM [16]. The McKinsey Global Institute calls big data “the next frontier for innovation, competition, and productivity” [17]. New technologies like crowdsourcing, data fusion, machine learning, and natural language processing are being used in commercial, civil, and military applications to improve the value of existing data sets and to derive a competitive advantage. A major shift is under way from technologies that simply store and archive data to those that process it—including real-time processing of multiple “streams” of information.
1.1.3 Multi-INT Tradecraft: Visualization, Statistics, and Spatiotemporal Analysis
Today, the most powerful computational techniques are being developed for business
intelligence, high-speed stock trading, and commercial retailing. These are analytic techniques—which intelligence professionals call their “tradecraft”—developed in tandem with the “big data” information explosion. They differ from legacy analysis techniques because they are visual, statistical, and spatial.
The emerging field of visual analytics is “the science of analytical reasoning facilitated by visual interactive interfaces” [20, p. 4]. It recognizes that humans are predisposed to recognize trends and patterns when they are presented using consistent and creative cognitive and perceptual techniques. Technological advances like high-resolution digital displays, powerful graphics cards and graphics processing units, and interactive visualization and human-machine interfaces have changed the way scientists and engineers analyze data. These methods include three-dimensional visualizations, clustering algorithms, data filtering techniques, and the use of color, shape, and motion to rapidly convey large volumes of information.
Next came the fusion of visualization techniques with statistical methods.
Analysts introduced methods for statistical storytelling, where mathematical functions are applied through a series of steps to describe interesting trends, eliminate infeasible alternatives, and discover anomalies so that decision makers can visualize and understand a complex decision space quickly and easily.
Geographic information systems (GISs) and the science of geoinformatics had been used since the late 1960s to display spatial information as maps and charts.
Increasingly, software tools like JMP, Tableau, GeoIQ, MapLarge, and ESRI ArcGIS have included advanced spatial and temporal analysis tools that advance the science of data analysis. The ability to analyze trends and patterns over space and time is called spatiotemporal analysis.
1.1.4 The Need for a New Methodology
The fourth age of intelligence is characterized by the changing nature of threats, the convergence in information technology, and the availability of multi-INT analytic tools—three drivers that create the conditions necessary for a revolution in intelligence tradecraft. This class of methods must address nonstate actors, leverage technological advances, and shift the focus of intelligence from reporting the past to anticipating the future. We refer to this revolution as ABI, a method that former RAND analyst and National Intelligence Council Greg Treverton chairman has called the most important intelligence analytic method coming out of the wars in Iraq and Afghanistan.
1.2 Introducing ABI
Intelligence analysts deployed to Iraq and Afghanistan to hunt down terrorists found that traditional intelligence methods were ill-suited for the mission. The traditional intelligence cycle begins with the target in mind (Figure 1.3), but terrorists were usually indistinguishable from other people around them. The analysts—digital natives savvy in visual analytic tools—began by integrating already collected data in a geographic area. Often, the only common metadata between two data sets was time and location so they applied spatiotemporal analytic methods to develop trends and patterns from large, diverse data sets. These data sets described activities: events and transactions conducted by entities (people or vehicles) in an area.
Often, the only common metadata between two data sets was time and location so they applied spatiotemporal analytic methods to develop trends and patterns from large, diverse data sets. These data sets described activities: events and transactions conducted by entities (people or vehicles) in an area. Sometimes, the analysts would discover a series of unusual events that correlated across data sets. When integrated, it represented the pattern of life of an entity. The entity sometimes became a target. The subsequent collection and analysis on this entity, the resolution of identity, and the anticipation of future activities based on the pattern of life produced a new range of intelligence products that improved the effectiveness of the counterterrorism mission. This is how ABI got its name.
ABI is a new methodology—a series of analytic methods and enabling technologies—based on the following four empirically derived principles, which are distinct from traditional intelligence methods.
• Georeference to discover: Focusing on spatially and temporally correlating multi-INT data to discover key events, trends, and patterns.
• Data neutrality: Prizing all data, regardless of the source, for analysis.
• Sequence neutrality: Realizing that sometimes the answer arrives before you ask the question.
While various intelligence agencies, working groups, and government bodies have offered numerous definitions for ABI, we define it as “a set of spatiotemporal analytic methods to discover correlations, resolve unknowns, understand networks, develop knowledge, and drive collection using diverse multi-INT data sets.”
ABI’s most significant contribution to the fourth age of intelligence is a shift in focus of the intelligence process from reporting the known to discovery of the unknown.
• Integration before exploitation: Correlating data as early as possible, rather than relying on vetted, finished intelligence products, because seemingly insignificant events in a single INT may be important when integrated across multi-INT.
1.2.1 The Primacy of Location
When you think about it, everything and everybody has to be somewhere.
—The Honorable James R. Clapper1, 2004
The primacy of location is the central principle behind the new intelligence methodology ABI. Since everything happens somewhere, all activities, events, entities, and relationships have an inherent spatial and temporal component whether it is known a priori or not.
Hard problems cannot usually be solved with a single data set. The ability to reference multiple data sets across multiple intelligence domains— multi-INT—is a key enabler to resolve entities that lack a signature in any single domain of collection. In some cases, the only common metadata between two data sets is location and time— allowing for location-based correlation of the observations in each data set where the strengths of one compensate for the weaknesses in another.
…the tipping point for the fourth age and key breakthrough for the ABI revolution was the ability and impetus to integrate the concept of location into visual and statistical analysis of large, complex data sets. This was the key breakthrough for the revolution that we call ABI.
1.2.2 From Target-Based to Activity-Based
The paradigm of intelligence and intelligence analysis has changed, driven primarily by the shift in targets from the primacy of nation-states to transnational groups or irregular forces—Greg Treverton, RAND
A target can be a physical location like an airfield or a missile silo. Alternatively, it can be an electronic target, like a specific radio-frequency emission or a telephone number. Targets can be individuals, such as spies who you want to recruit. Targets might be objects like specific ships, trucks, or satellites. In the cyberdomain, a target might be an e-mail address, an Internet protocol (IP) address, or even a specific device. The target is the subject of the intelligence question. The linear cycle of planning and direction, collection, processing and exploitation, analysis and production, and dissemination begins and ends with the target in mind.
The term “activity-based” is the antithesis of the “target-based” intelligence model. This book describes methods and techniques for intelligence analysis when the target or the target’s characteristics are not known a priori. In ABI, the target is the output of a deductive analytic process that begins with unresolved, ambiguous entities and a data landscape dominated by events and transactions.
Targets in traditional intelligence are well-defined, predictable adversaries with a known doctrine. If the enemy has a known doctrine, all you have to do is steal the manual and decode it, and you know what they will do.
In the ABI approach, instead of scheduled collection, incidental collection must be used to gather many (possibly irrelevant) events, transactions, and observations across multiple domains. In contrast to the predictable, linear, inductive approach, analysts apply deductive reasoning to eliminate what the answer is not and narrow the problem space to feasible alternatives. When the target blends in with the surroundings, a durable, “sense-able” signature may not be discernable. Proxies for the entity, such as a communications device, a vehicle, a credit card, or a pattern of actions, are used to infer patterns of life from observations of activities and transactions.
Informal collaboration and information sharing evolved as geospatial analysis tools became more democratized and distributed. Analysts share their observations—layered as dots on a map—and tell spatial stories about entities, their activities, their transactions, and their networks.
While traditional intelligence has long implemented techniques for researching, monitoring, and searching, the primary focus of ABI methods is on discovery of the unknown, which represents the hardest class of intelligence problems.
1.2.3 Shifting the Focus to Discovery
All truths are easy to understand once they are discovered; the point is to discover them.
—Galileo Galilei
The lower left corner of Figure 1.4 represents known-knowns: monitoring. These are known locations or targets, and the focus of the analytic operation is to monitor them for change.
the targets, location, behaviors, and signatures are all known. The intelligence task is monitoring the location for change and alerting when there is activity.
The next quadrant of interest is in the upper left of Figure 1.4. Here, the behaviors and signatures are unknown, but the targets or locations are known.
The research task builds deep contextual analytic knowledge to enhance understanding of known locations and targets, which can then be used to identify more targets for monitoring and enhance the ability to provide warning.
The lower right quadrant of Figure 1.4, search, requires looking for a known signature/behavior in an unknown location.
Searching previously undiscovered areas for the new equipment is search. For obvious reasons, this laborious task is universally loathed by analysts.
The “new” function and the focus of ABI methods is the upper right. You don’t know what you’re looking for, and you don’t know where to find it. This has always been the hardest problem for intelligence analysts, and we characterize it as “new” only because the methods, tools, policies, and tradecraft have only recently evolved to the point where discovery is possible outside of simple serendipity.
Discovery is a data-driven process. Analysts, ideally without bias, explore data sets to detect anomalies, characterize patterns, investigate interesting threads, evaluate trends, eliminate the impossible, and formulate hypotheses.
Typically, analysts who excel at discovery are detectives. They exhibit unusual curiosity, creativity, and critical thinking skills. Generally, they tend to be rule breakers. They get bored easily when tasked in the other three quadrants. New tools are easy for them to use. Spatial thinking, statistical analysis, hypothesis generation, and simulation make sense. This new generation of analysts—largely comprised of millennials hired after 9/11— catalyzed the evolution of ABI methods because they were placed in an environment that required a different approach. Frankly, their lack of experience with the traditional intelligence process created an environment where something new and different was possible.
1.2.4 Discovery Versus Search
Are we saying that hunting terrorists is the same as house shopping? Of course not, but the processes have their similarities. Location (and spatial analysis) is central to the search, discovery, research, and monitoring process. Browsing metadata helps triage information and focus the results. The problem constantly changes as new entities appear or disappear. Resources are limited and it’s impossible to action every lead…
1.2.6 Summary: The Key Attributes of ABI
ABI is a new tradecraft, focused on discovering the unknown, that is well-suited for advanced multi-INT analysis of nontraditional threats in a “big data” environment.
1.3 Organization of this Textbook
This textbook is directed at entry-level intelligence professionals, practicing engineers, and research scientists familiar with general principles of intelligence and analysis. It takes a unique perspective on the emerging methods and techniques of ABI with a specific focus on spatiotemporal analytics and the associated technology enablers.
The seminal concept of “pattern of life” is introduced in Chapter 8. Chapter 8 exposes the nuances of “pattern of life” versus pattern analysis and describes how both concepts can be used to understand complex data and draw conclusions using the activities and transactions of entities. The final key concept, incidental collection, is the subject of Chapter 9. Incidental collection is a core mindset shift from target-based point collection to wide area activity-based surveillance.
A unique feature of this textbook is its focus on applications from the public domain.
1.4 Disclaimer About Sources and Methods
Protecting sources and methods is the most paramount and sacred duty of intelligence professionals. This central tenet will be carried throughout this book. The development of ABI was catalyzed by advances in commercial data management and analytics technology applied to unique sources of data. Practitioners deployed to the field have the benefit of on-the-job training and experience working with diverse and difficult data sets. A primary function of this textbook is to normalize understanding across the community and inform emerging intelligence professionals of the latest advances in data analysis and visual analytics.
All of the application examples in this textbook are derived from information entirely in the public domain. Some of these examples have corollaries to intelligence operations and intelligence functions. Some are merely interesting applications of the basic principles of ABI to other fields where multisource correlation, patterns of life, and anticipatory analytics are commonplace. Increasingly, commercial companies are using similar “big data analytics” to understand patterns, resolve unknowns, and anticipate what may happen.
1.6 Suggested Readings
Readers unfamiliar with intelligence analysis, the disciplines of intelligence, and the U.S. intelligence community are encouraged to review the following texts before delving deep into the world of ABI:
• Lowenthal, Mark M., Intelligence: From Secrets to Policy. Lowenthal’s legendary text is the premier introduction to the U.S. intelligence community, the primary principles of intelligence, and the intelligence relationship to policy. The frequently updated text has been expanded to include Lowenthal’s running commentary on various policy issues including the Obama administration, intelligence reform, and Wikileaks. Lowenthal, once the assistant director of analysis at the CIA and vice chairman of Evaluation for the National Intelligence Council, is the ideal intellectual mentor for an early intelligence professional.
• George, Roger Z., and James B. Bruce, Analyzing Intelligence: Origins, Obstacles, and Innovations. This excellent introductory text by two Georgetown University professors is the most comprehensive text on analysis currently in print. It provides an overview of analysis tradecraft and how analysis is used to produce intelligence, with a focus on all-source intelligence.
• Heuer, Richards J., The Psychology of Intelligence Analysis. This book is required reading for intelligence analysts and documents how analysts think. It introduces the method of analysis of competing hypotheses (ACH) and deductive reasoning, a core principle of ABI.
• Heuer, Richards J., and Randolph H. Pherson, Structured Analytic Techniques for Intelligence Analysis. An extension of Heuer’s previous work, this is an excellent handbook of techniques for all-source analysts. Their techniques pair well with the spatiotemporal analytic methods discussed in this text.
• Waltz, Edward, Quantitative Intelligence Analysis: Applied Analytic Models, Simulations, and Games. Waltz’s highly detailed book describes modern modeling techniques for intelligence analysis. It is an essential companion text to many of the analytic methods described in Chapters 12–16.
2
ABI History and Origins
Over the past 15 years, ABI has entered the intelligence vernacular. Former NGA Letitia Long, said it is “a new foundation for intelligence analysis, as basic and as important as photographic interpretation and imagery analysis became during World War II”
2.1 Wartime Beginnings
ABI methods have been compared to many other disciplines including submarine hunting and policing, but the modern concepts of ABI trace their roots to the Global War on Terror. According to Long, “Special operations led the development of GEOINT-based multi-INT fusion techniques on which ABI is founded”
2.2 OUSD(I) Studies and the Origin of the Term ABI
During the summer of 2008 the technical collection and analysis (TCA) branch within the OUSD(I) determined the need for a document defining “persistent surveillance” in support of irregular warfare. The initial concept was a “pamphlet” that would briefly define persistence and expose the reader to the various surveillance concepts that supported this persistence. U.S. Central Command, the combatant command with assigned responsibility throughout the Middle East, expressed interest in using the pamphlet as a training aid and as a means to get its components to use the same vocabulary.
ABI was formally defined by the now widely circulated “USD(I) definition”:
A discipline of intelligence, where the analysis and subsequent collection is focused on the activity and transactions associated with an entity, a population, or an area of interest
There are several key elements of this definition. First, OUSD(I) sought to define ABI as a separate discipline of intelligence like HUMINT or SIGINT: SIGINT is to the communications domain as activity-INT is to the human domain. Recognizing that the INTs are defined by an act of Congress, this definition was later softened into a “method” or “methodology.”
The definition recognizes that ABI is focused on activity (composed of events and transactions, further explored in Chapter 4) rather than a specific target. It introduces the term entity, but also recognizes that analysis of the human domain could include populations or areas, as recognized by the related study called “human geography.”
Finally, the definition makes note of analysis and subsequent collection, also sometimes referred to as analysis driving collection. This emphasizes the importance of analysis over collection—a dramatic shift from the traditional collection-focused mindset of the intelligence community. To underscore the shift in focus from targets to entities, the paper introduced the topic of “human domain analytics.”
2.3 Human Domain Analytics
Human domain analytics is the global understanding of anything associated with people. The human domain provides the context and understanding of the activities and transactions necessary to resolve entities in the ABI method.
• The first is biographical information, or “who they are.” This includes information directly associated with an individual.
• The second data type is activities, or “what they do.” This data category associates specific actions to an entity.
• The third data category is relational, or “who they know,” the entities’ family, friends, and associates.
• The final data category is contextual (metaknowledge), which is information about the context or the environment in which the entity is found.
Examples include most of the information found within the sociocultural/human terrain studies. Taken in total, these data categories support ABI analysts in the analysis of entities, identity resolution of unknown entities, and placing the entities actions in a social context.
2.5 ABI-Enabling Technology Accelerates
In December 2012, BAE Systems was awarded a multiyear $60-million contract to provide “ABI systems, tools, and support for mission priorities” under the agency’s total application services for enterprise requirements (TASER) contract [13]. While these technology developments would bring new data sources to analysts, they also created confusion as the tools became conflated with the analytical methodology they were designed around. The phrase “ABI tool” would be attached to M111 and its successor program awarded under TASER.
2.6 Evolution of the Terminology
The term ABI and the introduction of the four pillars was first mentioned to the unclassified community during an educational session hosted by the U.S. Geospatial Intelligence Foundation (USGIF) at the GEOINT Symposium in 2010, but the term was introduced broadly in comments by Director of National Intelligence (DNI) Clapper and NGA director Long in their remarks at the 2012 symposium [14, 15].
As wider intelligence community efforts to adapt ABI to multiple missions took shape, the definition of ABI became generalized and evolved to a broader perspective as shown in Table 2.1. NGA’s Gauthier described it as “a set of methods for discovering patterns of behavior by correlating activity data at network speed and enormous scale” [16, p. 1]. It was also colloquially described by Gauthier and Long as, “finding things that don’t want to be found.”
2.7 Summary
Long described ABI as “the most important intelligence methodology of the first quarter of the 21st century,” noting the convergence of cloud computing technology, advanced tracking algorithms, inexpensive data storage, and revolutionary tradecraft that drove adoption of the methods [1].
3
Discovering the Pillars of ABI
The basic principles of ABI have been categorized as four fundamental “pillars.” These simple but powerful principles were developed by practitioners by cross-fertilizing best practices from other disciplines and applying them to intelligence problems in the field. They have evolved and solidified over the past five years as a community of interest developed around the topic. This chapter describes the origin and practice of the four pillars: georeference to discover, data neutrality, sequence neutrality, and integration before exploitation.
3.1 The First Day of a Different War
The U.S. intelligence community and most of the broader U.S. and western national security apparatus, was created to fight—and is expertly tuned for—the bipolar, state-centric conflict of the Cold War. Large states with vast bureaucracies and militaries molded in their image dominated the geopolitical landscape.
3.2 Georeference to Discover: “Everything Happens Somewhere”
Georeference to discover is the foundational pillar of ABI. It was derived from the simplest of notions but proves that simple concepts have tremendous power in their application.
Where activity happens—the spatial component—is the one aspect of these diverse data that is (potentially) common. The advent of the global positioning system (GPS)—and perhaps most importantly for the commercial realm, the de-activation of a mode called “selective availability”—has made precisely capturing “where things happen” move from the realm of science fiction to the reality of day-to-day living. With technological advances, location has become knowable.
3.2.1 First-Degree Direct Georeference
The most straightforward of these is direct georeferencing, which is where machine-readable geospatial content in the form of a coordinate system or known cadastral system is present in the metadata of a type of information. An example of this is metadata (simply, “data about data”) of a photo a GPS-enabled handheld camera or cell phone, for example, might give a series of GPS coordinates in degrees-minutes-seconds format.
3.2.2 First-Degree Indirect Georeference
By contrast, indirect georeferencing contains spatial information in non-machine-readable content, not ready for ingestion into a GIS.
an example of a metadata-based georeference in the same context would be a biographical profile of John Smith with the metadata tag “RESIDENCE: NOME, ALASKA.”
3.2.3 Second-Degree Georeference
Further down the georeferencing rabbit hole is the concept of a second-degree georeference. This is a special case of georeferencing where the content and metadata contain no first-degree georeferences, but analysis of the data in its context can provide a georeference.
For example, a poem about a beautiful summer day might not contain any first-degree georeferences, as it describes only a generic location. By reconsidering the poem as the “event” of “poem composition, a georeference can be derived. Because the poet lived at a known location, and the date of the poem’s composition is also known, the “poem composition event” occurred at “the poet’s house” on “the date of composition,” creating a second-degree georeference for a poem [5].
The concept of second-degree georeferencing is how we solve the vexing problem of data that does not appear, at first glance, to be “georeferenceable.” The above example shows how, by deriving events from data, we can identify activity that is more easily georeferenceable. This is one of the strongest responses to critics of the ABI methodology who argue that much, if not most, data does not lend itself to the georeferencing and overall data- conditioning process.
3.3 Discover to Georeference Versus Georeference to Discover
It is also important to contrast the philosophy of georeference to discover with the more traditional mindset of discover to georeference. Discover to georeference is a concept often not given a name but aptly describes the more traditional approach to geographically referencing information. This traditional process, based on keyword, relational, or Boolean-type queries, is illustrated in Figure 3.2. Often, the georeferencing that occurs in this process is manual, done via copy-paste from free text documents accessible to analysts.
With discover to georeference, the first question that is asked, often unconsciously, is, “This is an interesting piece of information; I should find out where it happened.” It can also be described as “pin-mapping,” based on the process of placing pins in a map to describe events of interest. The key difference is the a priori decision that a given event is relevant or irrelevant before the process of georeferencing begins.
Using the pillar of georeference to discover, the act of georeferencing is an integral part of the act of processing data, through either first- or second-degree attributes. It is the first step of the ABI analytic process and begins before the analyst ever looks at the data.
The act of georeferencing creates an inherently spatial and temporal data environment in which ABI analysts spend the bulk of their time, identifying spatial and temporal co-occurrences and examining said co-occurrences to identify correlations. This environment naturally leads the analyst to seek more sources of data to improve correlations and subsequent discovery.
3.4 Data Neutrality: Seeding the Multi-INT Spatial Data Environment
Data neutrality is the premise that all data may be relevant regardless of the source from which it was obtained. This is perhaps the most overlooked of the pillars of ABI because it is so simple as to be obvious. Some may dismiss this pillar as not important to the overall process of ABI, but it is central to the need to break down the cultural and institutional barriers between INT-specific “stovepipes” and consider all possible sources for understanding entities and their activities.
as the pillars were being developed, the practitioners who helped to write much of ABI’s lexicon spoke of data neutrality as a goal instead of a consequence. The importance of this distinction will be explored below, as it relates to the first pillar of georeference to discover.
Imagine again you are the analyst described in the prior section. In front of you is a spatial data environment in your GIS consisting of data obtained from many different sources of information, everything from reports from the lowest level of foot patrols to data collected from exquisite national assets. This data is represented as vectors: dots and lines (events and transactions) on your map. As you begin to correlate data via spatial and temporal attributes, you realize that data is data, and no one data source is necessarily favored over the others. The second pillar of ABI serves to then reinforce the importance of the first and naturally follows as a logical consequence.
Given that the act of data correlation is a core function of ABI, the conclusion that there can never be “too much” data is inevitable. “Too much,” in the inexact terms of an analyst, often means “more than I have the time, inclination, or capacity to understand,” but more often than that means “data that is not in a format conducive to examination in a single environment.” This becomes an important feature in understanding the data discovery mindset.
As the density of data increases, the necessity for smart technology for attribute correlation becomes a key component of the technical aspects of ABI. This challenge is exacerbated by the fact that some data sources include inherent uncertainty and must be represented by fuzzy boundaries, confidence bands, spatial polygons, ellipses, or circles representing circular error probability (CEP).
The spatial and temporal environment provides two of the three primary data filters for the ABI methodology: correlation on location and correlation on attributes. Attribute-based correlation becomes important to rule out false-positive correlations that have occurred solely based on space and time.
the nature of many data sources almost always requires human judgment regarding correlation across multiple domains or sources of information. Machine learning continues to struggle with these especially as it is difficult to describe the intangible context in which potential correlations occur.
Part of the importance of the data neutrality mindset is realizing the unique perspective that analysts bring to data analysis; moreover, this perspective cannot be easily realized in one type of analyst but is at its core the product of different perspectives collaborating on a similar problem set. This syncretic approach to analysis was central to the revolution of ABI, with technical analysts from two distinct intelligence disciplines collaborating and bringing their unique perspectives to their counterparts’ data sets.
3.5 Integration Before Exploitation: From Correlation to Discovery
The traditional intelligence cycle is a process often referred to as tasking, collection, processing, exploitation, and dissemination (TCPED).
TCPED is a familiar concept to intelligence professionals working in various technical disciplines who are responsible for making sense out of data in domains such as SIGINT and IMINT. Although often depicted as a cycle as shown in Figure 3.4, the process is also described as linear.
From a philosophical standpoint, TCPED makes several key assumptions:
• The ability to collect data is the scarcest resource, which implies that tasking is the most critical part of the data exploitation process. The first step of the process begins with tasking against a target, which assumes the target is known a priori.
• The most efficient way to derive knowledge in a single domain is through focused analysis of data, generally to the exclusion of specific contextual data.
• All data that is collected should be exploited and disseminated.
The limiting factor for CORONA missions was the number of images that could be taken by the satellite. In this model, tasking becomes supremely important: There are many more potential targets that can be imaged on a single roll of film. However, since satellite imaging in the CORONA era was a constrained exercise, processes were put in place to vet, validate, and rank-order tasking through an elaborate bureaucracy.
The other reality of phased exploitation is that it was a product of an adversary with signature and doctrine that, while not necessarily known, could be deduced or inferred over repeated observations. Large, conventional, doctrine-driven adversaries like the Soviet Union not only had large signatures, but their observable activities played out over a time scale that was easily captured by infrequent, scheduled revisit with satellites like CORONA. Although they developed advanced denial and deception techniques employed against imaging systems, both airborne and national, their large, observable activities were hard to hide.
But where is integration in this process? There is no “I,” big or small, in TCPED. Rather, integration was a subsequent step conducted very often by completely different analysts.
In today’s era of reduced observable signatures, fleeting enemies, and rapidly changing threat environments, integration after exploitation is seldom timely enough to provide decision advantage. The traditional concept of integration after exploitation, where finished reporting is only released when it exceeds the single-INT reporting threshold is shown in Figure 3.6. This approach not only suffers from a lack of timeliness but also is limited by the fact that only information deemed significant within a single-INT domain (without the contextual information provided by other INTs) is available for integration. For this reason, the single-INT workflows are often derisively referred to by intelligence professionals as “stovepipes” or as “stovepiped exploitation”.
While “raw” is a loaded term with specific meanings in certain disciplines and collection modalities, the theory is the same: The data you find yourself georeferencing, from any source you can get your hands on, is data that very often, has not made it into the formal intelligence report preparation and dissemination process. It is a very different kind of data, one for which the existing processes of TCPED and the intelligence cycle are inexactly tuned. Much of this information is well below the single-INT reporting threshold in Figure 3.6, but data neutrality tells us that while the individual pieces of information may not exceed the domain thresholds, the combined value of several pieces in an integrated review may not only exceed reporting thresholds but could reveal unique insight to a problem that would be otherwise undiscoverable to the analyst.
TCPED is a dated concept because of its inherent emphasis on the tasking and collection functions. The mindset that collection is a limited commodity influences and biases the gathering of information by requiring such analysts to decide a priori what is important. This is inconsistent with the goals of the ABI methodology. Instead, ABI offers a paradigm more suited to a world in which data has become not a scarcity, but a commodity: the relative de-emphasis of tasking collection versus a new emphasis on the tasking of analysis and exploitation
The result of being awash in data is that no longer can manual exploitation processes scale. New advances in collection systems like the constellation of small satellites proposed by Google’s Skybox will offer far more data than even a legion of trained imagery analysts could possibly exploit. There are several solutions to this problem of “drowning in data”:
• Collect less data (or perhaps, less irrelevant data and more relevant data);
• Integrate data earlier, using correlations to guide labor-intensive exploitation processes;
• Use smart technology to move techniques traditionally deemed “exploitation” into the “processing” stage.
These three solutions are not mutually exclusive, though note that the first two represent philosophically divergent viewpoints on the problem of data. ABI naturally chooses both the second and third solution. In fact, ABI is one of a small handful of approaches that actually becomes far more powerful as the represented data volume of activity increases because of the increased probability of correlations.
The analytic process emphasis in ABI also bears resemblance to the structured geospatial analytic method (SGAM), first posited by researchers at Penn State University
Foraging, then, is not only a process that analysts use but also a type of attitude that seeks to be embedded in the analytical mindset: The process of foraging is a continual one spanning not only specific lines of inquiry but also evolves beyond the boundaries of specific questions, turning the “foraging process” into a consistent quest for more data.
Another implication is precisely where in the data acquisition chain an ABI analyst should ideally be placed. Rather than putting integrated analysis at the end of the TCPED process, this concept argues for placing the analyst as close to the data collection point (or point of operational integration) as possible. While this differs greatly for tactical missions versus strategic missions, the result of placing the analyst as close to the data acquisition and processing components is clear: The analyst has additional opportunities not only to acquire new data but affect the acquisition and processing of data from the ground up, making more data available to the entire enterprise through his or her individual efforts.
3.6 Sequence Neutrality: Temporal Implications for Data Correlation
Sequence neutrality is perhaps the least understood and most complex of the pillars of ABI. The first three pillars are generally easily understood after a sentence or two of explanation (though they have deeper implications for the analytical process as we continually explore their meaning). Sequence neutrality, on the other hand, forces us to consider—and in many ways, reconsider—the implications of temporality with regard to causality and causal reasoning. As ABI moves data analysis to a world governed by correlation rather than causation, the specter of causation must be addressed.
In epistemology, this concept is described as narrative fallacy. Naseem Taleb, in his 2007 work Black Swan, explains it as “[addressing] our limited ability to look at sequences of facts without weaving an explanation into them, or, equivalently, forcing a logical link, an arrow of relationship upon them. Explanations bind facts together. They make them all the more easily remembered; they help them make more sense” [12]. What is important in Taleb’s statement is the concept of sequence: Events occur in order, and we weave a logical relationship around them.
As events happen in sequence, we chain them together even given our limited perspective on the accuracy with which those events represent reality. When assessing patterns—true patterns, not correlations—in single-source data sets, time proves to be a useful filter presuming that the percentage of the “full” data set represented remains relatively consistent. As we introduce additional datasets, the potential gaps multiply causing uncertainty to exponentially increase. In intelligence, as many data sets are acquired in an adversarial rather than cooperative fashion (as opposed to in traditional civil GIS approaches, or even crime mapping approaches), this concept becomes so important that it is given a name: sparse data.
You are integrating the data well before stovepiped exploitation and have created a data-neutral environment in which you can ask complex questions of the data. This enables and illuminates a key concept of sequence neutrality: The data itself drives the kinds of questions that you ask. In this way, we express a key component of sequence neutrality as “understanding that we have the answers to many questions we do not yet know to ask.”
The corollary to this realization is the importance of forensic correlation versus linear-forward correlation. If we have the answers to many questions in our spatial-temporal data environment, it then follows logically that the first place to search for answers—to search for correlations—is in the data environment we have already created. Since the data environment is based on what has already been collected, the resultant approach is necessarily forensic. Look backward, before looking forward.
From card catalogs and libraries we have moved to search algorithms and metadata, allowing us as analysts to quickly and efficiently employ a forensic, research-based approach to seeking correlations.
As software platforms evolved, more intuitive time-based filtering was employed, allowing analysts to easily “scroll through time.” As with many technological developments, however, there was also a less obvious downside related to narrative fallacy and event sequencing: The time slider allowed analysts to see temporally referenced data occur in sequence, reinforcing the belief that because certain events happened after other events, they may have been caused by them. It also made it easy to temporally search for patterns in data sets: useful again in single data sets, but potentially highly misleading in multisourced data sets due to the previously discussed sparse data problem. Sequence neutrality, then, is not only an expression of the forensic mindset but a statement of warning to the analyst to consider the value of sequenced versus nonsequenced approaches to analysis. Humans have an intuitive bias to see causality when there is only correlation. We caution against use of advanced analytic tools without the proper training and mindset adjustment.
3.6.1 Sequence Neutrality’s Focus on Metadata: Section 215 and the Bulk Telephony Metadata Program Under the USA Patriot Act
By positing that all data represents answers to certain questions, it implores us to collect and preserve the maximum amount of data as possible, limited only by storage space and cost. It also begs the creation of indexes within supermassive data sets, allowing us to zero in on key attributes of data that may only represent a fraction of the total data size.
A controversial provision of the USA PATRIOT act, Section 215, allows the director of the Federal Bureau of Investigation (or designee) to seek access to “certain business records” which may include “any tangible things (including books, records, papers, documents, and other items) for an investigation to protect against international terrorism or clandestine intelligence activities, provided that such investigation of a United States person is not conducted sole upon the basis of activities protected by the first amendment to the Constitution”.
3.7 After Next: From Pillars, to Concepts, to Practical Applications
The pillars of ABI represent the core concepts, as derived by the first practitioners of ABI. Rather than a framework invented in a classroom, the pillars were based on the actual experiences of analysts in the field, working with real data against real mission sets. It was in this environment, forged by the demands of asymmetric warfare and enabled by accelerating technology, in which ABI emerged as one of the first examples of data-driven intelligence analysis approaches, focused primarily on spatial and temporal correlation as a means to discover.
The foraging-sensemaking, data-centric, sequence-neutral analysis paradigm of ABI conflicts with the linear- forward TCPED-centric approaches used in “tipping-cueing” constructs. The tip/cue concept slews (moves) sensors to observed or predicted activity based on forecasted sensor collection, accelerating warning on known knowns. This concept ignores the wealth of known data about the world in favor of simple additive constructs that if not carefully understood, risk biasing analysts with predetermined conclusions from arrayed collection systems
While some traditional practitioners are uncomfortable with the prospect of “releasing unfinished intelligence,” the ABI paradigm—awash in data—leverages the power of “everything happens somewhere” to discover the unknown. As a corollary, when many things happen in the same place and time, this is generally an indication of activity of interest. Correlation across multiple data sources improves our confidence in true positives and eliminates false positives.
4
The Lexicon of ABI
The development of ABI also included the development of a unique lexicon, terminology, and ontology to accompany it.
Activity data “comprises physical actions, behaviors, and information received about entities. The focus of analysis in ABI, activity is the overarching term used for ‘what entities do.’ Activity can be subdivided into two types based on its accompanying metadata and analytical use: events and transactions”.
4.1 Ontology for ABI
One of the challenges of intelligence approaches for the data-rich world that we now live in is integration of data.
As the diversity of data increased, analysts were confronted with the problem that most human analysts deal with today: How does one represent diverse data in a common way?
An ontology is the formal naming and documentation of interrelationships between concepts and terms in a discipline. Established fields like biology and telecommunications have well-established standards and ontologies. As the diversity of data and the scope of a discipline increases, so does the complexity of the ontology. If the ontology becomes too rigid and requires too many committee approvals to adapt to change, it cannot easily account for new data types that emerge as technology advances.
Moreover, with complex ontologies for data, complex environments are required for analysis, and it becomes extraordinarily difficult to correlate and connect data (to say nothing of conclusions derived from data correlations) in any environment other than a pen-to-paper notebook or a person’s mind.
4.2 Activity Data: “Things People Do”
The first core concept that “activity” data reinforces is the idea that ABI is ultimately about people, which, in ABI, we primarily refer to as “entities.”
Activity in ABI is information relating to “things people do.” While this is perhaps a simplistic explanation, it is important to the role of ABI. In ABI parlance, activities are not about places or equipment or objects.
4.2.1 “Activity” Versus “Activities”
The vernacular and book title use the term “activity-based intelligence,” but in early discussions, the phrase was “activities-based intelligence.” Activities are the differentiated, atomic, individual activities of entities (people). Activity is a broad construct to describe aggregated activities over space and time.
4.2.2 Events and Transactions
The definition in the introduction to this chapter defined activity data as “physical actions, behaviors, and information received about entities” but also divided activity data into two categories: events and transactions. These types are distinguished based on their metadata and utility for analysis. To limit the scope of the ABI ontology (translation: to avoid making an ontology that describes every possible action that could be performed by every possible type of entity), we specifically categorize all activity data into either an event or transaction based on the metadata that accompanies the data of interest.
a person living in a residence—provides a very different kind of event, one that is far less specific. While a residential address or location can also be considered biographical data, the fact of a person living in a specific place is treated as an event because of its spatial metadata component.
In all three examples, spatial metadata is the most important component.
The concept of analyzing georeferenced events is not specific to military or intelligence analysis. The GDELT project maintains a 100% free and open database of 300 kinds of events using data in over 100 languages with daily updates from January 1, 1979, to the present. The database contains over 400 million georeferenced data points
Characterization is an important concept because it can sometimes appear as if we are using events as a type of context. In this way, activities can characterize other activities. This is important because most activity conducted by entities does not occur in a vacuum; it occurs simultaneously with activities conducted by different entities that occur in either the same place or time—and sometimes both.
Events that occur in close proximity provide us an indirect way to relate entities together based on individual data points. There is, however, a more direct way to relate entities together through the second type of activity data: transactions.
4.2.3 Transactions: Temporal Registration
Transactions in ABI provide us with our first form of data that directly relates entities. A transaction is defined as “an exchange of information between entities (through the observation of proxies) and has a finite beginning and end”. This exchange of information is essentially the instantaneous expression of a relationship between two entities. This relationship can take many forms, but it exists for at least the duration of the transaction.
Transactions are of supreme importance in ABI because they represent relationships between entities. Transactions are typically observed between proxies, or representations of entities, and are therefore indirect representations of the entities themselves.
For example, police performing a stakeout of a suspect’s home may not observe the entity of interest, but they may follow his or her vehicle. The vehicle is a proxy. The departure from the home is an event. The origin-destination motion of the vehicle is a transaction. Analysts use transactions to connect entities and locations together, depending on the type of transaction.
Transactions come in two major subtypes: physical transactions and logical transactions. Physical transactions are exchanges that occur primarily in physical space, or, in other words, the real world.
Logical transactions represent the other major subtype of transaction. These types of transactions are easier to join directly to proxies for entities (and therefore, the entities themselves) because the actual transaction occurs in cyberspace as opposed to physical space.
4.2.4 Event or Transaction? The Answer is (Sometimes) Yes
Defining data as either an event or transaction is as much a function of understanding its role in the analytical process as much as it is about recognizing present metadata fields and “binning” it into one of two large groups. Consequently, there are certain data types that can be treated as both events and transactions depending on the circumstances and analytical use.
4.3 Contextual Data: Providing the Backdrop to Understand Activity
One of the important points to understand with regard to activity data is that its full meaning is often unintelligible without understanding the context in which observed activity is occurring.
“Contextualization is crucial in transforming senseless data into real information”
Activity data in ABI is the same: To understand it fully, we must understand the context in which it occurs, and context is a kind of data all unto itself.
There are many different kinds of contextual data.
Activity data and contextual data help understand the nature of events and transactions—and sometimes even to anticipate what might happen.
4.4 Biographical Data: Attributes of Entities
Biographical data provides information about an entity: name, age, date of birth, and other similar attributes. Because ABI is as much about entities as it is about activity, considering the types of data that apply specifically to entities is extremely important. Biographical data provides analysts with context to understand the meaning of activity conducted between entities.
the process of entity resolution (fundamentally, disambiguation) enables us to understand additional biographical information about entities.
Police departments, intelligence agencies, and even private organizations have long desired to understand specific details about individuals; therefore, what is it that makes ABI a fundamentally different analytic methodology? The answer is in the relationship of this biographical data to events and transactions described in Sections 4.2.2–4.2.4 and the fusion of different data types across the ABI ontology at speed and scale.
Unlike in more traditional approaches, wherein analysts might start with an individual of interest and attempt to “fill out” the baseball card, ABI starts with the events and transactions (activity) of many entities, ultimately attempting to narrow down to specific individuals of interest. This is one of the techniques that ABI uses to conquer the problem of unknown individuals in a network, which guards against the possibility that the most important entities might be ones that are completely unknown to individual analysts.
The final piece of the “puzzle” of ABI’s data ontology is relating entities to each other—but unlike transactions, we begin to understand generalized links and macronetworks. Fundamentally, this is relational data.
4.5 Relational Data: Networks of Entities
Entities do not exist in vacuums.
considering the context of relationships between entities is also of extreme importance in ABI. Relational data tells us about the entity’s relationships to other entities, through formal and informal institutions, social networks, and other means.
Initially, it is difficult to differentiate relational data from transaction data. Both data types are fundamentally about relating entities together; what, therefore, is the difference between the two?
The answer is that one type— transactions—represents specific expressions of a relationship, while the other type— relational data—is the generalized data based on both biographical data and activity data relevant to specific entities.
The importance of understanding general relationships between entities cannot be overstated; it is one of several effective ways to contextualize specific expressions of relationships in the form of transactions. Traditionally, this process would be to simply use specific data to form general conclusions (an inductive process, explored in Chapter 5). In ABI, however, deductive and abductive processes are preferred (whereby the general informs our evaluation of the specific). In the context of events and transactions, our understanding of the relational networks pertinent to two or more entities can help us determine whether connections between events and transactions are the product of mere coincidence (or density of activity in a given environment) or the product of a relationship between individuals or networks.
SNA can be an important complementary approach to ABI, but each focuses on different aspects of data and seeks a fundamentally different outcome, indicating that the two are not duplicative approaches.
What ABI and SNA share, however, is an appreciation for the importance of understanding entities and relationships as a method for answering particular types of questions.
4.6 Analytical and Technological Implications
Relational and biographical information regarding entities is supremely important for contextualizing events and transactions, but unlike earlier approaches to analysis and traditional manhunting, focusing on specific entities from the outset is not the hallmark innovation of ABI.
5
Analytical Methods and ABI
Over the past five years, the intelligence community and the analytic corps have adopted the term ABI and ABI- like principles into their analytic workflows. While the methods have easily been adapted by those new to the field —especially those “digital natives” with strong analytic credentials from their everyday lives—traditionalists have been confused about the nature of this intelligence revolution.
5.1 Revisiting the Modern Intelligence Framework
John Hollister Hedley, a long-serving CIA officer and editor of the President’s Daily Brief (PDB) outlines three broad categories of intelligence: 1) strategic or “estimative” intelligence; 2) current intelligence, and 3) basic intelligence
“finished” intelligence continues to be the frame around which much of today’s intelligence literature is constructed.
our existing intelligence framework needs expansion to account for ABI and other methodologies sharing similar intellectual approaches.
5.2 The Case for Discovery
In an increasingly data-driven world, the possibility of analytical methods that do not square with our existing categories of intelligence seems inevitable. The authors argue that ABI is the first of potentially many methods that belong in this category, which can be broadly labeled as “discovery,” sitting equally alongside current intelligence, strategic intelligence, and basic intelligence.
What characterizes discovery? Most intelligence analysts, many of whom are naturally inquisitive, already conduct aspects of discovery instinctively as they go about their day-to-day jobs. But there has been a growing chorus of concerns from both the analytical community and IC leadership that intelligence production has become increasingly driven by specific tasks and questions posed by policymakers and warfighters. In part, this is understandable: If policymakers and warfighters are the two major customer sets served by intelligence agencies, then it is natural for these agencies to be responsive to the perceived or articulated needs of those customers. However, need responsiveness does not encompass the potential to identify correlations and issues previously unknown or poorly understood by consumers of intelligence production. This is where discovery comes in: the category of intelligence primarily focused on identifying relevant and previously unknown potential information to provide decision advantage in the absence of specific requirements to do so.
institutional innovation often assumes (implicitly) a desire to innovate equally distributed across a given employee population. This egalitarian model of innovation, however, is belied by actual research showing that creativity is more concentrated in certain segments of the population
If “discovery” in intelligence is similar to “innovation” in technology, one consequence is that the desire to perform—and success at performing— “discovery” is unequally distributed across the population of intelligence analysts, and that different analysts will want to (and be able to) spend different amounts of time on “discovery.” Innovation is about finding new things based on a broad understanding of needs but lacking specific subtasks or requirements
ABI is one set of methods under the broad heading of discovery, but other methods—some familiar to the world of big data—also fit in the heading. ABI’s focus on spatial and temporal correlation for entity resolution through disambiguation is a specific set of methods designed for the specific problem of human networks
data neutrality’s application puts information gathered from open sources and social media up against information collected from clandestine and technical means. Rather than biasing analysis in favor of traditional sources of intelligence data, social media data is brought into the fold without establishing a separate exploitation workflow.
One of the criticisms of the Director of National Intelligence (DNI) Open Source Center, and the creation of OSINT as another domain of intelligence, was that it effectively served to create another stovepipe within the intelligence world,
ABI’s successes came from partnering, not replacing, single-INT analysts in battlefield tactical operations centers (TOCs).
The all-source analysis field is more typically (though not always) focused on higher-order judgments and adversary intentions; it effectively operates at a level of abstraction above both ABI and single-INT exploitation.
This is most evident in approaches to strategic issues dealing with state actors; all-source analysis seeks to provide a comprehensive understanding of current issues enabling intelligent forecasting of future events, while ABI focuses on entity resolution through disambiguation (using identical methodological approaches found on the counterinsurgency/counterterrorism battlefield) relevant to the very same state actors.
5.4 Decomposing an Intelligence Problem for ABI
One of the critical aspects of properly applying ABI is about asking the “right” questions. In essence, the challenge is to decompose a high-level intelligence problem into a series of subproblems, often posed as questions, that can potentially be answered using ABI methods.
As ABI focuses on disambiguation of entities, the problem must be decomposed to a level where disambiguation of particular entities helps fill intelligence gaps relating to the near-peer state power. As subproblems are identified, approaches or methods to address the specific subproblems are aligned to each subproblem in turn, creating an overall approach for tackling the larger intelligence problem. In this case, ABI does not become directly applicable to the overall intelligence problem until the subproblem specifically dealing with the pattern of life of a group of entities is extracted from the larger problem.
Another example problem to which ABI would be applicable is identifying unknown entities outside of formal leadership structures who may be key influencers outside of the given hierarchy through analyzing entities present at a location known to be associated with high-level leadership of the near-peer state.
5.5 The W3 Approaches: Locations Connected Through People and People Connected Through Locations
Once immersed in a multi-INT spatial data environment, there are two major approaches used in ABI to establish network knowledge and connect entities . These two approaches are summarized below, both dealing with connecting entities and locations. Together they are known as “W3” approaches, combining “who” and “where” to extend analyst knowledge of social and physical networks.
5.5.1 Relating Entities Through Common Locations
This approach focuses on connecting entities based on presence at common locations. Analysis begins with a known entity and then moves to identifying other entities present at the same location.
The process for evaluating strength of relationship based on locational proximity and type of location relies on the concepts of durability and discreteness, a concept further explored in Chapter 7. Colloquially, this process is known as “who-where-who,” and it is primarily focused on building out logical networks.
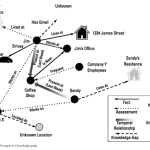
A perfect example of building out logical networks through locations begins with two entities—people, unique individuals—observed at a private residence on multiple occasions. In a spatial data environment, the presence of two entities at the same location at multiple points in time might bear investigation into the various attributes of those entities. The research process initially might show no apparent connection between them, but by continuing to understand various aspects of the entities, the locational connection may be corroborated and “confirmed” via the respective attributes of the entities. This could take many forms, including common social contacts, family members, and employers.
The easiest way to step through “who-where-who” is through a series of four questions. These questions offer an analyst the ability to logically step through a potential relationship through the colocation of individual entities. The first question is: “What is the entity or group of entities of interest?” This is often expressed as a simple “who” in shorthand, but the focus here is in identifying a specific entity or group of entities that are of interest to the analyst. Note that while ABI’s origins are in counterterrorism and thus, the search for “hostile entities,” the entities of interest could also be neutral or friendly entities, depending on what kind of organization the analyst is a part of.
In practice, this phase will consist of using known entities of interest and examining locations where the entities have been present. This process can often lead to constructing a full “pattern of life” for one or more specific entities, but it can also be as simple as identifying locations where entities were located on one or more specific occasions
The first question is: “What is the entity or group of entities of interest?” This is often expressed as a simple “who” in shorthand, but the focus here is in identifying a specific entity or group of entities that are of interest to the analyst.
In practice, this phase will consist of using known entities of interest and examining locations where the entities have been present. This process can often lead to constructing a full “pattern of life” for one or more specific entities, but it can also be as simple as identifying locations where entities were located on one or more specific occasions
The second question is: “Where has this entity been observed?” At this point, focus is on the spatial-temporal data environment. The goal here is to establish various locations where the entity was present along with as precise a time as possible.
The third question is: “What other entities have also been observed at these locations?” This is perhaps the most important of the four questions in this process. Here, the goal is to identify entities co-occurring with the entity or entities of interest. The focus is on spatial co-occurrence, ideally over multiple locations. This intuitive point— more co-occurrences increases the likelihood of a true correlation—is present in the math used to describe a linear correlation function:
the characteristics of each location considered must be evaluated in order to separate out “chance co-occurrences” versus “demonstrative co-occurrences.” In addition, referring back to the pillar of sequence neutrality, it is vitally important to consider the potential for co-occurrences that are temporally separated. This often occurs when networks of entities change their membership but use consistent locations for their activities, as is the case with many clubs and societies.
The fourth and final question is: “Is locational proximity indicative of some kind of relationship between the initial entity and the discovered entity?”
the goal is to take an existing network of entities and identify additional entities that may have been partially known or completely unknown. The overwhelming majority of entities must interact with each other, particularly to achieve common goals, and this analytic technique helps identify entities that are related based on common locations before metadata or attribute- based explicit relationships.
5.5.2 Relating Locations Through Common Entities
This approach is the inverse of the previous approach and focuses on connecting locations based on the presence of common entities. By tracking entities to multiple locations, connections between locations can be revealed.
Where the previous process is focused on building out logical networks where entities are the nodes, this process focuses on building out either logical or physical networks where locations are the nodes. While at first this can seem less relevant to a methodology focused on understanding networks of entities, understanding the physical network of locations helps indirectly reveal information about entities who use physical locations for various means (nefarious and nonnefarious alike).
The first question asked in this process is, “What is the initial location or locations of interest?” This is the most deceptively difficult question to answer, because it involves bounding the initial area of interest.
The next question brings us back to entities: “What entities have been observed at this location?” Whether considering one or more locations, this is where specific entities can be identified or partially known entities can be identified for further research. This is one of the core differences between the two approaches, in that there is no explicit a priori assumption regarding the entities of interest. This question is where pure “entity discovery” occurs, as focusing on locations allows entities not discovered through traditional, relational searches to emerge as potentially relevant players in multiple networks of interest.
The third question is, “Where else have these entities been observed?” This is where a network of related locations is principally constructed. Based on the entities—or networks—discovered in the previous phase of research, the goal is now to associate additional, previously unknown locations based on common entities.
One of the principal uses of this information is to identify locations that share a common group of entities. In limited cases, this approach can be predictive, indicating locations that entities may be associated with even if they have not yet been observed at a given location.
The final question is thus, “Is the presence of common entities indicative of a relationship between locations?”
Discovering correlation between entities and locations is only the first step, as subsequently contextual information must be examined dispassionately to support or refute the hypothesis suggested by entity commonality.
At this point, the assessment aspect of both methods must be discussed. By separating what is “known” to be true versus what is “believed” to be true, analysts can attempt to provide maximum value to intelligence customers.
5.6 Assessments: What Is Known Versus What Is Believed
At the end of both methods is an assessment question: Has the process of moving from vast amounts of data to specific data about entities and locations provided correlations that demonstrate actual relationships between entities and/or locations?
Correlation versus causation can quickly become a problem in the assessment phase, as well as the role of chance in spatial or temporal correlation of data. The assessment phase of each method is designed to help analysts separate out random chance from relevant relationships in the data.
ABI adapts new terminology from a classic problem of intelligence assessments, which is separating fact from belief.
Particularly with assessments that rest on correlations present across several degrees of data, the potential for alternative explanations must always be considered. While the concepts themselves are common across intelligence methodologies, these are of paramount importance in properly understanding and assessing the “information” created through assessment of correlated data.
Abduction, perhaps the least known in popular culture, represents the most relevant form of inferential reasoning for the ABI analyst. It is also the form of reasoning most commonly employed by Sir Arthur Conan Doyle’s Sherlock Holmes, despite references to Holmes as the master of deduction. Abduction can be thought of as “inference to the best explanation,” where rather than a conclusion guaranteed by the premises, the conclusion is expressed as a “best guess” based on background knowledge and specific observations.
5.7 Facts: What Is Known
Allowance must be made for uncertainty even in the identification of facts; even narrowly scoped, facts can turn out to be untrue for a variety of reasons. Despite this tension, distinguishing between facts and assessments is a useful mental exercise. It also serves to introduce the concept of a key assumption check (KAC) into ABI, as what ABI terms “facts” overlaps some with what other intelligence methodologies term “assumptions.”
Another useful way to conceptualize facts is “information as reported from the primary source.”
5.8 Assessments: What Is Believed or “Thought”
Assessment is where the specific becomes general. Assessment is one of the key functions performed by intelligence analysts, and it is one of very few common attributes across functions, echelons, and types of analysts. It is also not, strictly speaking, the sole province of ABI.
5.9 Gaps: What Is Unknown
ABI identifies correlated data based on spatial and temporal co-occurrence, but it does not explicitly seek to assign meaning to the correlation or place it in a larger context.
There are times, however, when the method cannot even reach assessment level due to “getting stuck” during research of spatial and temporal correlations. This is where the concept of “unfinished threads’ becomes vitally important.
5.9 Gaps: What Is Unknown
The last piece of the assessment puzzle is “gaps.” This is in many ways the inverse of “facts” and can inform assessments as much as “facts” can. Gaps, like facts, must be stated as narrowly and explicitly as possible in order to identify areas for further research or where the collection of additional data is required.
Gap identification is a crucial skill for most analytic methods because of natural human tendencies to either ignore contradictory information or construct narratives that explain incomplete or missing information.
5.10 Unfinished Threads
Every time a prior initiates one or both of the principal methods discussed earlier in this chapter, an investigation begins.
True to its place in “discovery intelligence,” ABI not only makes allowances for the existence of these unfinished threads, it explicitly generates techniques to address these threads and uses them for the maximum benefit of the analytical process.
Unfinished threads are important for several reasons. First, they represent the institutionalization of the discovery process within ABI. Rather than force a process by which a finished product must be generated, ABI allows for the analyst to pause and even walk away from a particular line of inquiry for any number of reasons. Second, unfinished threads can at times lead an analyst into parallel or even completely unrelated threads that are as important, or even more important, than the initial thread. This process, called “thread hopping,” is one expression of a nonlinear workflow inside of ABI.
One of the most challenging problems presented by unfinished threads is preserving threads for later investigation. Methods for doing so are both technical (computer software designed to preserve these threads, discussed further in Chapter 15) and nontechnical, such as scrap paper, whiteboards, and pen-and-paper notebooks. This is particularly important when new information arrives, especially when the investigating analyst did not specifically request the new information.
By maintaining a discovery mindset and continuing to explore threads from various different sources of information, the full power of ABI—combined with the art and intuition present in the best analysts— can be realized.
5.11 Leaving Room for Art And Intuition
One of the hardest challenges for structured approaches to intelligence analysis is carving out a place for human intuition and, indeed, a bit of artistry. The difficulty of describing and near impossibility of teaching intuition make it tempting to omit it from any discussion of analytic methods in an effort to focus on that which is teachable. To do so, however, would be both unrealistic as well as a disservice to the critical role that intuition— properly understood and subject to appropriate —can play in the analytic process.
Interpretation is an innate, universal, and quintessentially intuitive human faculty. It is field-specific, in the sense that one’s being good at interpreting, say, faces or pictures or modern poetry does not guarantee success at interpreting contracts or statues. It is not a rule-bound activity, and the reason a judge is likely to be a better interpreter of a statute than of a poem, and a literary critic a better interpreter of a poem than a statute, is the experience creates a repository of buried knowledge on which intuition can draw when one is faced with a new interpretandum – Judge Richard Posner
At all times, however, these intuitions must be subject to rigorous scrutiny and cross-checking, to ensure their validity is supported by evidence and that alternative or “chance” explanations cannot also account for the spatial or temporal connections in data.
Fundamentally, there is a role for structured thinking about problems, application of documented techniques, and artistry and intuition when examining correlations in spatial and temporal data. Practice in these techniques and practical application that builds experience are both equally valuable in developing the skills of an ABI practitioner.
6
Disambiguation and Entity Resolution
Entity resolution or disambiguation through multi-INT correlation is a primary function of ABI. Entities and their activities, however, are rarely directly observable across multiple phenomenologies. Thus, we need an approach that considers proxies —indirect representations of entities—which are often directly observable through various means.
6.1 A World of Proxies
As entities are a central focus of ABI, all of an entity’s attributes are potentially relevant to the analytical process. That said, a subset of attributes called proxies is the focus of analysis as described in Chapter 5. A proxy “is an observable identifier used as a substitute for an entity, limited by its durability (i.e., influenced by the entity’s ability to change/alter proxies)”
Focusing on any particular, “average” entity results in a manageable number of proxies.2 However, beginning with a given entity is fundamentally a problem of “knowns.” How can an analyst identify an “unknown entity?”
Now the problem becomes more acute. Without using a given entity to filter potential proxies, all proxies must be considered; this number is likely very large and for the purposes of this chapter is n. The challenge that ABI’s spatio-temporal methodology confronts is going from n, or all proxies, to a subset of n that relates to an individual or group of individuals. In some cases, n can be as limited as a single proxy. The process of moving from n to the subset of n is called disambiguation.
6.2 Disambiguation
Disambiguation is not a concept unique to ABI. Indeed, it is something most people do every day in a variety of settings, for a variety of different reasons. A simple example of disambiguation is using facial features to disambiguate between two different people. This basic staple of human interaction is so important that an inability to do so is a named disorder—prosopagnosia.
Disambiguation is a conceptually simple process; accordingly, the actual process of disambiguation is severely complicated by incomplete, erroneous, misleading, or insufficiently specific data.
Without discounting the utility of more “general” proxies like appearance and clothing and vehicle types, it is the “unique” identifiers that offer the most probative value in the process of disambiguation and that, ultimately, are most useful in achieving the ultimate goal: entity resolution.
6.3 Unique Identifiers—“Better” Proxies
To understand fully why unique identifiers are of such importance to the analytical process in ABI, a concept extending the data ontology of “events” and “transactions” from Chapter 4 must be introduced. This concept is called certainty of identity.
This concept has a direct analog in the computing world—the universal unique identifier (UUID) or globally unique identifier (GUID) [3, 4]. In distributed computing environments—linking together disparate databases— UUIDs or GUIDs are the mechanism to disambiguate objects in the computing environments [4]. This is done against the backdrop of massive data stores from various different sources in the computing and database world.
In ABI, the same concept is applied to the “world’s” spatiotemporal data store: Space and time provide the functions to associate unique identifiers (proxies) with each other and with entities. The proxies can then be used to identify the same entity across multiple data sources, allowing for a highly accurate understanding of an entity’s movement and therefore behavior.
6.4 Resolving the Entity
As the core of ABI’s analytic methodology revolves around discovering entities through spatial and temporal correlations in large data sets across multiple INTs, the process of entity resolution principally through spatial and temporal attributes is the defining attribute of ABI’s analytical methodology and represents ABI’s enduring contribution to the overall discipline of intelligence analysis.
Entity resolution is “the iterative and additive process of uniquely identifying and characterizing an [entity], known or unknown, through the process of correlating event/transaction data generated by proxies to the [entity]”.
Entity resolution itself is not unique to ABI. Data mining and database efforts in computer science focus intense amounts of effort on entity resolution. These efforts are known by a number of different terms (e.g., record linkage, de-duplication, and co-reference resolution), but all focus on “the problem of extracting, matching, and resolving entity mentions in structured and unstructured data”.
In ABI, “entity mentions” are contained within activity data. This encompasses both events and transactions, as both can involve a specific detection of a proxy. As shown in Figure 6.4, transactions always involve proxies at the endpoints, or “vertices” of the transaction. Events also provide proxies, but these can range from general (example, a georeferenced report stating that a particular house is an entity’s residence) to highly specific (a time-stamped detection of a radio-frequency identification tag at a given location).
6.5 Two Basic Types of Entity Resolution
Ultimately, the process of entity resolution can be broken into two categories: proxy-to-entity resolution and proxy-to-proxy resolution. Both types have specific use cases in ABI and can provide valuable information pertinent to an entity of interest, ultimately helping answer intelligence questions.
6.5.1 Proxy-to-Proxy Resolution
Proxy-to-proxy resolution through spatiotemporal correlation is not just an important aspect of ABI; it is one of the defining concepts of ABI. But why is this? At face value, entity resolution is ultimately the goal of ABI. Therefore, how does resolving one proxy to another proxy help advance understanding of an entity and relate it to its relevant proxies?
The answer is found at the beginning of this chapter: entities cannot be directly observed. Therefore, any kind of resolution must by definition be relating one proxy to another proxy, through space and time and across multiple domains of information.
What the various sizes of circles introduce is the concept of CEP (Figure 6.5). CEP was originally introduced as a measure of accuracy in ballistics, representing the radius of the circle within which 50% of “rounds” or “warheads” were expected to fall. A smaller CEP indicated a more accurate weapon system. This concept has been expanded to represent the accuracy of geolocation of any item (not just a shell or round from a weapons system), particularly with the proliferation of GPS-based locations [9]. Even systems such as GPS, which are designed to provide accurate geolocations, have some degree of error.
This simple example illustrates the power of multiple observations over space and time for proper disambiguation and resolving proxies from one data source to proxies from another data source. This was a simplistic thought experiment. The bounds were clearly defined, and there was a 1:1 ratio of Vehicles:Unique Identifiers, both of which were of a known quantity (four each). Real-world conditions and problems will rarely present such clean results for an analyst or for a computer algorithm. The methods and techniques for entity disambiguation over space and time have been extensively researched over the past 30 years by the multisensor data fusion community.
6.5.2 Proxy-to-Entity Resolution: Indexing
While proxy-to-proxy resolution is at the heart of ABI, the importance of proxy-to-entity resolution, or indexing, cannot be overstated. Indexing is a broad term used for various processes, most outside the strict bounds of ABI, that help link proxies to entities through a variety of technical and nontechnical means. Indexing takes placed based on values within single information sources (rather than across them) and is often done in the process of focused exploitation on a single source or type of data.
Indexing is essentially an automated way of helping analysts build up an understanding of attributes of an entity. In intelligence, this often focuses around a particular collection mechanism or phenomenology; the same is true with regard to law enforcement and public records, where vehicle registration databases, RFID toll road passes, and other useful information is binned according to data class and searchable using relational keys. While not directly a part of the ABI analytic process, access to these databases provides analysts with an important advantage in determining potential entities to resolve to proxies in the environment.
6.6 Iterative Resolution and Limitations on Entity Resolution
Even the best proxies, however, have limitations. This is why we refer to the relevant items as proxies instead of signatures in ABI. A signature is something characteristic, indicative of identity. Most importantly, signatures have inherent meaning, typically detectable in a single phenomenology or domain of information. Proxies, however, lack the same inherent meaning, though in everyday use, the two are often conflated – This, however, is not always the case.
These challenges necessitate the key concept of iterative resolution in ABI; in essence, practitioners must consistently re-examine proxies to determine whether they are still valid for entities of interest. By revisiting Figure 6.2, it is intuitively clear that certain proxies are easier to change, while others are far more difficult. When deliberate operations security (OPSEC) practices are introduced from terrorists, insurgents, intelligence officers, and other entities who are trained in countersurveillance and counterintelligence efforts, it can be even more challenging to evaluate the validity of a given proxy for an individual at an individual point in time. These limits on connecting proxies to entities describe perhaps the most prominent challenges
These limits on connecting proxies to entities describe perhaps the most prominent challenges
to disambiguation and entity resolution amongst very similar proxies: the concept of discreteness, relative to physical location, and durability, relative to proxies. Together these capture the limitations of the modern world that are passed through to the analytical process underpinning ABI.
7
Discreteness and Durability in the Analytical Process
The two most important factors in ABI analysis are the discreteness of locations and durability of proxies. For shorthand, these two concepts are often referred to simply as discreteness and durability. Discreteness of locations deals with the different properties of physical locations, focusing on the use of particular locations by entities and groups of entities that can be expected to interact with given locations, taking into account factors like climate, time of day, and cultural norms. Durability of proxies addresses an entity’s ability to change or alter given proxies and therefore, the analyst’s need to periodically revalidate or reconfirm the validity of a given proxy for an entity of interest.
7.1 Real World Limits of Disambiguation and Entity Resolution
Discreteness and durability are designed as umbrella terms: They help express the real-world limits of an analyst’s ability to disambiguate unique identifiers through space and time and ultimately, match proxies to entities and thereby perform entity resolution. They also present the two greatest challenges to attempts to automate the core precepts of ABI: Because the concepts are “fuzzy,” and there are no agreed-upon standards or scales used to express discreteness and durability, automating the resolution process remains a monumental challenge. This section illustrates general concepts with an eye toward use by human analysts.
disambiguation and entity resolution amongst very similar proxies: the concept of discreteness, relative to physical location, and durability, relative to proxies. Together these capture the limitations of the modern world that are passed through to the analytical process underpinning ABI.
7.2 Applying Discreteness to Space-Time
Understanding the application of discreteness (of location) to space-time begins with revisiting the concept of disambiguation.
Disambiguation is one of the most important processes for both algorithms and human beings, and one of the major challenges involves assigning confidence values (either qualitative or quantitative) to the results of disambiguation, particularly with respect to the character of given locations, geographic regions, or even particular structures.
But why does the character of a location matter? The answer is simple, even intuitive: Not all people, or entities, can access all locations, regions, or buildings. Thus, when discussing the discreteness value of a given location, whether it is measured qualitatively or quantitatively, the measure is always relative to an entity or group/network of entities.
Considering that the process of disambiguation begins with the full set of “all entities,” the ability to subsequently narrow the potential pool of entities generating observable proxies in a given location based on the entities who would have natural access to a given location can be an extraordinarily powerful tool in the analysis process.
ABI’s analytic process uses a simple spectrum to describe the general nature of given locations. This spectrum provides a starting point for more complex analyses, but the significant gap of a detailed quantitative framework to describe the complexity of locations remains. This is an open area for research and one of ABI’s true hard problems.
7.3 A Spectrum for Describing Locational Discreteness
In keeping with ABI’s development as a grassroots effort among intelligence analysts confronted with novel problems, a basic spectrum is used to divide locations into three categories of discreteness:
• Non-discrete
• Discrete
• Semi-discrete
The categories of discreteness are temporally sensitive, representing the dynamic and changing use of locations, facilities, and buildings on a daily, sometimes even hourly, basis. Culture, norms, and local customs all factor into the analytical “discreteness value” that aids ABI practitioners in evaluating the diagnosticity of a potential proxy-entity pair.
Evidence is diagnostic when it influences an analyst’s judgment on the relative likelihood of the various hypotheses. If an item of evidence seems consistent with all hypotheses, it may have no diagnostic value at all. It is a common experience to discover that the most available evidence really is not very helpful, as it can be reconciled with all the hypotheses.
This concept can be directly applied to disambiguation among proxies and resolving proxies to entities. Two critical questions are used to evaluate locational discreteness—the diagnosticity—of a given proxy observation. The first question is, “How many other proxies are present in this location and therefore may be resolved to entities through spatial co-occurrence?” This addresses the disambiguation function of ABI’s methodology. The second question is, “What is the likelihood that the presence of a given proxy at this location represents a portion of unique entity behavior?”
Despite these difficulties, multiple proxy observations over space and time (even at nondiscrete locations) can be chained together to produce the same kind of entity resolution [1]. An analyst would likely need additional observations at nondiscrete locations to provide increased confidence in an entity’s relationship to a location or to resolve an unresolved proxy to a given entity.
A discrete location is a location that is unique to an entity or network of entities at a given time. Observations of proxies at discrete locations, therefore, are far more diagnostic in nature because they are restricted to a highly limited entity network. The paramount example of a discrete location is a private residence.
Revisiting the two principal questions from above, the following characteristics emerge regarding a discrete location:
• Proxies present at a private residence can be associated with a small network of entities, the majority of whom are connected through direct relationships to the entity or entities residing at the location;
• Entities present at this location can presumptively be associated with the group of entities for whom the location is a principal residence.
As discussed earlier, discrete locations can be far from perfect.
7.4 Discreteness and Temporal Sensitivity
Temporal sensitivity with respect to discreteness is a concept used to describe how the use of locations by entities (and therefore the associated discreteness values) changes over time; the change in function affects a change in the associated discreteness. While this may seem quite abstract, it is actually a concept many are comfortable with from an early age.
when viewed at the macro level, the daily and subdaily variance in activity levels across multiple entities is referred to as a pattern of activity,
7.5 Durability of Proxy-Entity Associations
The durability of proxies remains the other major factor contributing to the difficulty of disambiguation and entity resolution
Though many proxies can (and are often) associated with single entities, these associations can range from nearly permanent to extraordinarily fleeting. The concept of durability represents the range of potential values for the duration of time of the proxy-entity association.
Answering “who-where-who” and “where-who-where” workflow questions becomes exponentially more difficult when varying degrees of uncertainty in spatial-temporal correlation are introduced by the two major factors discussed in this chapter. Accordingly, structured approaches for analysts to consider the effects of discreteness and durability are highly recommended, particularly as supporting material to overall analytical judgments.
One continuous recommendation in all types of intelligence analysis is that assumptions made in the analytical process should be made explicit, so that intelligence consumers can understand what is being assumed, what is being assessed, and how assessments might change based on changes in the underlying assumptions presented by an analyst [2, pp. 9, 16]. One recommended technique is using a matrix during the analytic process to make explicit discreteness and durability factors in an effort to incorporate them into the overall judgments and conclusions. In addition, the use of a matrix can provide key values that can later be used to develop quantitative expressions of uncertainty, but these expressions are fundamentally meaningless without the underlying quantifications clearly expressed (in essence, creating a “values index” so that the overall quantified value can be properly contextualized).
Above all, analysts must be continually encouraged by their leadership and intelligence consumers to clearly express uncertainty and “show their work.” Revealing flaws and weaknesses in a logical assessment are unfortunately often perceived as weakness, and this tendency is reinforced by consumers that attack probabilistic assessments and express desires for stronger, “less ambiguous” results of analyses. The limitations of all analytic methodologies must be expressed, but in ABI this becomes a particularly important point.
8
Patterns of Life and Activity Patterns
8.1 Entities and Patterns of Life
“Pattern(s) of life,” like many concepts in and around ABI, suffers from an inadequate written literature and varying applications depending on the speaker or writer’s context.
These concepts are familiar to law enforcement officers, who through direct surveillance techniques have constructed patterns of life on suspects for many years. One of the challenges in ABI explored in Section 8.2 is the use of indirect, sparse observations to construct entity patterns of life.
With discreteness, the varying uses of geographic locations over days, weeks, months, and even years is examined as part of the analytical process for ABI. Patterns of life are a related concept: A pattern of life is defined as the specific set of behaviors and movements associated with a particular entity over a given period of time. In simple terms, this is what people do everyday:
.At times, the term “pattern of life” has been used to describe behaviors associated with a specific object (for instance, a ship) as well as to describe the behaviors and activity observed in a particular location or region. An example would be criminal investigators staking out a suspect’s residence: They would learn the various comings and goings of many different entities, and see various activities taking place at the residence. In essence, they are observing small portions of individual patterns of life from many different entities, but the totality of this activity is sometimes also described in the same way.
One truth about patterns of life is that they cannot be observed or fully understood through periodic observations.
In sum, four important principles emerge regarding the formerly nebulous concept of “pattern of life”:
1. A pattern of life is specific to an individual entity;
2. Longer observations provide better insight into an entity’s overall pattern of life;
3. Even the lengthiest surveillance cannot observe the totality of an individual’s pattern of life;
4. Traditional means of information gathering and intelligence collection reveal only a snapshot of an entity’s pattern of life.
While it can be tempting to generalize or assume on the basis of what is observed, it is important to account for the possibilities during times in which an entity goes unobserved by technical or human collection mechanisms. In the context of law enforcement, the manpower cost of around-the-clock surveillance quickly emerges, and the need for officers to be reassigned to other tasks and investigate other crimes can quickly take precedence over the need to maintain surveillance on a given entity. Naturally, the advantage of technical collection versus human collection in terms of temporal persistence is evident.
Small pieces of a puzzle, however, are still useful. So too are different ways of measuring the day-to-day activities conducted by specific entities of interest (e.g., Internet usage, driving habits, and phone calls). Commercial marketers have long since taken advantage of this kind of data in order to more precisely target advertisements and directed sales pitches. However, these sub-aspects of an entity’s pattern of life are important in their own right and are the building blocks from which an overall pattern of life can be constructed.
8.2 Pattern-of-Life Elements
Pattern-of-life elements are the “building blocks” of a pattern of life. These elements can be measured in one or many different dimensions, each providing unique insight about entity behavior and ultimately contributing to a more complex overall picture of an entity. These elements can be broken down into two major categories:
• Partial observations, where the entity is observed for a fixed duration of time;
• Single-dimension measurements, where a particular aspect of behavior or activity is measured over time in order to provide insight into that specific dimension of entity behavior or activity.
The limitations of the sensor platform (resolution, spectrum, field of view) all play a role in the operator’s ability to assess whether the individual who emerged later was the same individual entity who entered the room, but even a high-confidence assessment is still an assessment, and there remains a nonzero chance that the entity of interest did not emerge from the room at all.
8.3 The Importance of Activity Patterns
activity patterns constructed from data sets containing multiple entities will not be effective tools for disambiguation.
Understanding the concept and implications of data aggregation is important in assessing both the utility and limitations of activity patterns. The first and most important rule of data aggregation is that aggregated data represents a summary of the original data set. Regardless of aggregation technique, no summary of data can (by definition) be as precise or accurate as the original set of data. Therefore, activity patterns constructed from data sets containing multiple entities will not be effective tools for disambiguation.
Effective disambiguation requires precise data, and summarized activity patterns cannot provide this.
If activity patterns—large sets of data containing summarized activity or movement from multiple entities—are not useful for disambiguation, why mention them at all in the context of ABI? There are two primary reasons.
One is that on a fairly frequent basis, activity patterns are mistakenly characterized as patterns of life without properly distinguishing the boundary between specific behavior of an individual and the general behaviors of a group of individuals [4, 5].
The second reason is that despite this confusion, activity patterns can play an important role in the analytical process: They provide an understanding of the larger context in which a specific activity occurs.
8.4 Normalcy and Intelligence
“Normal” or “abnormal” are descriptors that appear often in discussions regarding ABI. Examining the descriptions at a deeper level, however, reveals that these descriptors are often applied to activity pattern analysis, an approach to analysis distinct from ABI. The basis in logic works as follows:
• Understand and “baseline” what is normal;
• Alert when a change is made (thus, when “abnormal” occurs).
Cynthia Grabo, a former senior analyst at the Defense Intelligence Agency, defines warning intelligence as dealing with:
(a) direct action by hostile states against the U.S. or its allies, involving the commitment of their regular or irregular armed forces
(b) other developments, particularly conflicts, affecting U.S. security interests in which such hostile states are or might become involved
(c) significant military action between other nations not allied with the U.S., and
(d) the threat of terrorist action” [6].
Thus, warning is primarily concerned with what may happen in the future.
8.5 Representing Patterns of Life While Resolving Entities
Until this point, disambiguation/entity resolution and patterns of life have been discussed as separate concepts. In reality, however, the two processes often occur simultaneously. As analysts disambiguate proxies and ultimately resolve them to entities, pieces of an entity’s pattern of life are assembled. Once a proxy of interest is identified— even before entity resolution fully occurs—the process of monitoring a proxy creates observations: pattern-of-life elements.
8.5.1 Graph Representation
One of the most useful ways to preserve nonhierarchical information is in graph form. Rather than focus on specific technology, this section will describe briefly the concept of a graph representation and discuss benefits and drawbacks to the approach. Graphs have a number of advantages, but the single most relevant advantage is the ability to combine and represent relationships between data points from different sources.
8.5.2 Quantitative and Temporal Representation
With quantitative and temporal data, alternate views may be more appropriate. Here, traditional views of representing periodicity and aggregated activity patterns are ideal; this allows appropriate generalization across various time scales. Example uses of quantitative representation for single-dimensional measurements (a pattern-of-life element) include the representation of periodic activity.
Figure 8.5 is an example of how analysts can discern any potential correlations between activity levels and day of the week and make recommendations accordingly. This view of data would be considered a single-dimensional measurement, and thus a pattern of life element.
8.6 Enabling Action Through Patterns of Life
One important element missing from most discussions of pattern of life is “Why construct patterns of life at all?” Having an entity’s pattern of life, whether friendly, neutral, or hostile, is simply a means to an end, like all intelligence methodologies. The goal is not only to provide decision advantage at a strategic level but operational advantage at the tactical level.
Understanding events, transactions, and activity patterns also allows analysis to drive collection and identifies areas of significance where further collection operations can help reveal more information about previously hidden networks of entities. Patterns of life and pattern-of-life elements are just one representation of knowledge gained through the analytic process, ultimately contributing to overall decision advantage.
9
Incidental Collection
This chapter explores the concept of incidental collection by contrasting the change in the problem space: from Cold War–era order of battle to dynamic targets and human networks on the 21st century physical and virtual battlefields.
9.1 A Legacy of Targets
The modern intelligence system—in particular, technical intelligence collection capabilities—was constructed around a single adversary, the Soviet Union.
9.2 Bonus Collection from Known Targets
Incidental collection is a relatively new term, but it is not the first expression of the underlying concept. In imagery parlance, “bonus” collection has always been present, from the very first days of “standing target decks.” A simple example of this starts with a military garrison. The garrison might have several buildings for various purposes, including repair depots, vehicle storage, and barracks. In many cases, it might be located in the vicinity of a major population center, but with some separation depending on doctrine, geography, and other factors.
A satellite might periodically image this garrison, looking for vehicle movement, exercise starts, and other potentially significant activity. The garrison, however, only has an area of 5 km2, whereas the imaging satellite produces images that span almost 50 km by 10 km. The result, as shown in Figure 9.1, is that other locations outside of the garrison—the “primary target”—are captured on the image. This additional image area could include other structures, military targets, or locations of potential interest, all of which constitute “bonus” collection.
Incidental collection, rather than identifying a specific intelligence question as the requirement, focuses on the acquisition of large amounts data over a relevant spatial region or technical data type and sets volume of data obtained as a key metric of success. This helps address the looming problem of unknowns buried deep in activity data by maximizing the potential chances for spatiotemporal data correlations. Ultimately, this philosophy maximizes opportunities for proxy-entity pairing and entity resolution.
The Congressional Research Services concluded in 2013, “While the intelligence community is not entirely without its legacy ‘stovepipes,’ the challenge more than a decade after 9/11 is largely one of information overload, not information sharing. Analysts now face the task of connecting disparate, minute data points buried within large volumes of intelligence traffic shared between different intelligence agencies.
9.4 Dumpster Diving and Spatial Archive and Retrieval
In intelligence, collection is focused almost exclusively on the process of prioritizing and obtaining through technical means the data that should be available “next.” In other words, the focus is on what the satellite will collect tomorrow, as opposed to what it has already collected, from 10 years ago to 10 minutes ago. But vast troves of data are already collected, many of which are quickly triaged and then discarded as lacking intelligence value. ABI’s pillar of sequence neutrality emphasizes the importance of spatial correlations across breaks in time, so maintaining and maximizing utility from data already being collected for very different purposes is in effect a form of incidental collection.
Repurposing of existing data through application of ABI’s georeference to discover pillar is colloquially called “dumpster diving” by some analysts.
Repurposing data through the process of data conditioning (extracting spatial, temporal, and other key metadata features and indexing based on those features) is a form of incidental collection and is critical to ABI. This is because the information in many cases was collected to service-specific collection requirements and/or information needs but is then used to fill different information needs and generate new knowledge. Thus, the use of this repurposed data is incidental to the original collection intent. This process can be applied across all types of targeted, exquisite forms of intelligence. Individual data points, when aggregated into complete data sets, become incidentally collected data.
Trajectory Magazine wrote in its Winter 2012 issue, “A group of GEOINT analysts deployed to Iraq and Afghanistan began pulling intelligence disciplines together around the 2004–2006 timeframe…these analysts hit upon a concept called ‘geospatial multi-INT fusion.’” Analysts recognized that the one field that all data had in common was location.
9.5 Rethinking the Balance Between Tasking and Exploitation
Incidental collection has direct and disruptive implications for several pieces of the traditional TCPED cycle. The first and perhaps most significant is drastically re-examining the nature of the requirements and tasking process traditionally employed in most intelligence disciplines.
The current formal process for developing intelligence requirements was established after the Second World War, and remains largely in use today. It replaced an ad hoc, informal process of gathering intelligence and professionalized the business of developing requirements [7].
Like most formal intelligence processes, the legacy of Cold War intelligence requirements was tuned to the unique situation between 1945 and 1991, a bipolar contest between two major state adversaries: the United States and the Soviet Union. Thus the process was created with assumptions that, while true at the time, have become increasingly questionable in the unipolar world with numerous near-peer state competitors and increasingly powerful nonstate actors and organizations.
“satisficing”—collecting just enough that the requirement was fulfilled—required a clear understanding of the goals from the development of the requirement and management of the collection process. This, of course, meant that the information needs driving requirement generation, by definition, had to be clearly known, such that technical collection systems could be precisely tasked.
The shift of the modern era from clandestine and technical sensors to new, high-volume approaches to technical collection; wide-area and persistent sensors with long dwell times; and increasing use of massive volumes of information derived from open and commercial sources demands a parallel shift in emphasis of the tasking process. Because of the massive volumes of information gained from incidentally collected—or constructed—data sets, tasking is no longer the most important function. Rather, focusing increasingly taxed exploitation resources becomes critical; in addition, the careful application of automation to prepare data in an integrated fashion (performing functions like feature extraction, georeferencing, and semantic understanding) is necessary. “We must transition from a target-based, inductive approach to ISR that is centered on processing, exploitation, and dissemination to a problem-based, deductive, active, and anticipatory approach that focuses on end-to-end ISR operations,” according to Maj. Gen. John Shanahan, commander of the 25th Air Force who adds that automation is “a must have”.
Focusing on exploiting specific pieces of data is only one part of the puzzle. A new paradigm for collection must be coupled to the shift from tasking collection to tasking exploitation. Rather than seeking answers to predefined intelligence needs, collection attuned to ABI’s methodology demands seeking data, in order to enable correlations and entity resolution.
9.6 Collecting to Maximize Incidental Gain
The concept of broad collection requirements is not new. ABI, however, is fed by broad requirements for specific data, a new dichotomy not yet confronted by the intelligence and law enforcement communities. This necessitates a change in the tasking and collection paradigms employed in support of ABI, dubbed coarse tasking for discovery.
Decomposing this concept identifies two important parts: the first is the concept of coarse tasking, and the second is the concept of discovery. Coarse tasking first moves collection away from the historical use of collection decks consisting of point targets: specific locations on the Earth. These decks have been used for both airborne and space assets, providing a checklist of targets to service. Coverage of the target in a deck-based system constitutes task fulfillment, and the field of view for a sensor can in many cases cover multiple targets at once.
The tasking model used in collection decks is specific, not coarse, providing the most relevant point of contrast with collection specifically designed for supporting ABI analysis.
Rather than measuring fulfillment via a checklist model, coarse tasking’s goal is to maximize the amount of data (and as a corollary, the amount of potential correlations) in a given collection window. This is made possible because the analytic process of spatiotemporal correlation is what provides information and ultimately meaning to analysts, and the pillar of data neutrality does not force analysts to draw conclusions from any one source, instead relying on the correlations between sources to provide value. Thus, collection for ABI can be best measured through volume, identification and conditioning of relevant metadata features, and spatiotemporal referencing.
9.7 Incidental Collection and Privacy
This approach can raise serious concerns regarding privacy. “Collect it all, sort it out later” is an approach that, when applied to signals intelligence, raised grave concern about the potential for collection against U.S. citizens.
Incidental collection has been portrayed in a negative light with respect to the Section 215 metadata collection program [9]. Part of this, however, is a direct result of the failure of intelligence policy and social norms to keep up with the rapid pace of technological development.
U.S. intelligence agencies, by law, cannot operate domestically, with narrow exceptions carved out for disaster relief functions in supporting roles to lead federal agencies.
. While this book will not delve into textual analysis of existing law and policy, one issue that agencies will be forced to confront is the ability of commercial “big data” companies like Google and Amazon to conduct the kind of precision analysis formerly possible only in a government security context.
10
Data, Big Data, and Datafication
The principle of data neutrality espouses the use of new types of data in new ways. ABI represented a revolution in how intelligence analysts worked with a volume, velocity, and variety of data never before experienced.
10.1 Data
Deriving value from large volumes of disparate data is the primary objective of an intelligence analyst.
Data is comprised of the atomic facts, statistics, observations, measurements, and pieces of information that are the core commodity for knowledge workers like intelligence analysts. Data represents the things we know.
The discipline of intelligence used to be data-poor. The things we did not know, and the data we could not obtain far outnumbered the things we knew and the data we had. Today, the digital explosion complicates the work environment because there is so much data that it is simply not possible to gather, process, visualize, and understand it all. Historical intelligence textbooks describe techniques for reasoning through limited data sets and making informed judgments, but analysts today have the possibility to obtain exceedingly large quantities of data. The key skill now is the ability to triage, prioritize, and correlate information from a giant volume of data.
10.1.1 Classifying Data: Structured, Unstructured, and Semistructured
The first distinction in data management relies on classification of data into one of three categories: structured data, unstructured data, or semistructured data.
Structured Data
SQL works well with relational databases, but critics highlight the lack of portability of SQL queries across RDBMSs from different vendors due to implementation nuances of relational principles and query languages.
As data tables grow in size (number of rows), performance is limited, because many calculations must search the entire table.
Unstructured Data
“Not only SQL” (NoSQL) is a database concept for modeling data that does not fit well into the tabular model in relational databases. There are two classifications of NoSQL databases, key-value and graph.
One of the advantages of NoSQL databases is the property of horizontal scalability, which is also called sharding. Sharding partitions the database into smaller elements based on the value of a field and distributes this to multiple nodes for storage and processing. This improves the performance of calculations and queries that can be processed as subelements of a larger problem using a model called “scatter-gather” where individual processing tasks are farmed out to distributed data storage locations and the resulting calculations are reaggregated and sent to a central location.
Semistructured Data
The term semistructured data is technically a subset of unstructured data and refers to tagged or taggable data that does not strictly follow a tabular or database record format. Examples include markup languages like XML and HTML where the data inside a file may be queried and analyzed with automated processes, but there is no simple query language that is universally applicable.
Semistructured databases do not require formal governance, but operating a large data enterprise without a governance model makes it difficult to find data and maintain interoperability across data sets.
10.1.2 Metadata
Metadata is usually defined glibly as “data about data.” The purpose of metadata is to organize, describe, and identify data. The schema of a database is one type of metadata. The categories of tags used for unstructured or semistructured data sets are also a type of metadata.
Metadata may include extracted or processed information from the actual content of the data.
Clip marks—analyst-annotated explanations of the content of the video—are considered metadata attached to the raw video stream.
Sometimes, the only common metadata between data sets is time and location. We consider these the central metadata values for ABI. The third primary metadata field is a unique identifier. This may include the ID of the individual piece of data or may be associated with a specific object or entity that has a unique identifier. Because one of the primary purposes of ABI is to disambiguate entities and because analytic judgments must be traced to the data used to create it, identifying data with unique identifiers (even across multiple databases) is key to enabling analysis techniques.
10.1.3 Taxonomies, Ontologies, and Folksonomies
A taxonomy is the systematic classification of information, usually into a hierarchical structure of entities of interest.
Because many military organizations and nation-state governments are hierarchical, they are easily modeled in a taxonomy. Also, because the type and classification of military forces (e.g., aircraft, armored infantry, and battleships.) are generally universal across different countries, the relative strength of two different countries is easily compared. Large businesses can be described using this type of information model. Taxonomies consist of classes but only one type of relationship: “is child/subordinate of.”
An ontology “provides a shared vocabulary that can be used to model a domain, that is, the type of objects and or concepts that exist and their properties and relations” (emphasis added) [6, p. 5]. Ontologies are formal and explicit, but unlike taxonomies, they need not be hierarchical.
Most modern problems have evolved from taxonomic classification to ontological classification to include the shared vocabulary for both objects and relationships. Ontologies pair well with the graph-based NoSQL database method. It is important to note that ontologies are formalized, which requires an existing body of knowledge about the problem and data elements.
With the proliferation of unstructured data, user-generated content, and democratized access to information management resources, the term folksonomy evolved to describe the method for collaboratively creating and translating tags to categorize information [7]. Unlike taxonomies and ontologies that are formalized, folksonomies evolve as user-generated tags are added to published content. Also, there is no hierarchical (parent-child) relationship between tags. This technique is useful for highly emergent or little understood problems where an analyst describes attributes of a problem, observations, detections, issues, or objects but the data does not fit an existing model. Over time, as standard practices and common terms are developed, a folksonomy may be evolved into an ontology that is formally governed
10.2 Big Data
Big data is an overarching term that refers to data sets so large and complex they cannot be stored, processed, or used with traditional information management techniques. Altamira’s John Eberhardt defines it as “any data collection that cannot be managed as a single instance”
10.2.1 Volume, Velocity, and Variety…
In 2001, Gartner analyst Doug Laney introduced the now ubiquitous three-dimensional characterization of “big data” as increasing in volume, velocity, and variety [13]:
Volume: The increase in the sheer number and size of records that must be indexed, managed, archived, and transmitted across information systems.
Velocity: The dramatic speed at which new data is being created and the speed at which processing and exploitation algorithms must execute to keep up with and extract value from data in real time. In the big data paradigm, “batch” processing of large data files is insufficient.
Variety: While traditional data was highly structured, organized, and seldom disseminated outside an organization, today’s data sets are mostly unstructured, schema-less, and evolutionary. The number and type of data sets considered for any analytic task is growing rapidly.
Since Laney’s original description of “the three V’s,” a number of additional “V’s” have been proposed to characterize big data problems. Some of these are described as follows:
Veracity: The truth and validity of the data in question. This includes confidence, pedigree, and the ability to validate the results of processing algorithms applied across multiple data sets. Data is meaningless if it is wrong. Incorrect data leads to incorrect conclusions with serious consequences.
Vulnerability: The need to secure data from theft at rest and corruption in motion. Data analysis is meaningless if the integrity and security of the data cannot be guaranteed.
Visualization: Including techniques for making sense of “big data.” (See Chapter 13.)
Variability: The variations in meaning across multiple data sets. Different sources may use the same term to mean different things, or different terms may have the same semantic meaning.
Value: The end result of data analysis. The ability to extract meaningful and actionable conclusions with sufficient confidence to drive strategic actions. Ultimately, value drives the consequence of data and its usefulness to support decision making.
Because intelligence professionals are called on to make judgments, and because these judgments rely on the underlying data, any failure to discover, correlate, trust, understand, or interpret data or processed and derived data and metadata diminishes the value of the entire intelligence process.
10.2.2 Big Data Architecture
“Big data” definitions say that a fundamentally different approach to storage, management, and processing of data is required under this new paradigm, but what are some of the technology advances and system architectural distinctions to enable “big data?”
Most “big data” storage architectures use a key-value store based on Google’s BigTable. Accumulo is a variant of BigTable that was developed by the National Security Agency (NSA) beginning in 2008. Accumulo augments the BigTable data model to add cell-level security, which means that a user or algorithm seeking data from any cell in the database must satisfy a “column visibility” attribute of the primary key.
Hadoop relies on a distributed, scalable Java file system, the Hadoop distributed file system (HDFS), which stores large files (gigabytes to terabytes) across multiple nodes with replication to prevent data loss. Typically, the data is replicated three times, with two local copies and one copy at a geographically remote location.
Recognizing that information is increasingly produced by a number of high-volume, real-time devices and must be integrated and processed rapidly to derive value, IBM began the System S research project as “a programming model and an execution platform for user-developed applications that ingest, filter, analyze, and correlate potentially massive volumes of continuous data streams”.
10.2.3 Big Data in the Intelligence Community
Recognizing that information technology spending across the 17 intelligence agencies accounts for nearly 20% of National Intelligence Program funding, the intelligence community embarked on an ambitious consolidation program called the intelligence community information technology environment (IC-ITE), pronounced “eye-sight”
10.3 The Datafication of Intelligence
In 2013, Kenneth Neil Cukier and Victor Mayer-Schöenberger introduced the term “datafication” to describe the emergent transformation of everything to data. “Once we datafy things, we can transform their purpose and turn the information into new forms of value,” they said.
Over the last 10 years, direct application of commercial “big data” analytic techniques to the intelligence community has thus far missed the mark. There are a number of reasons for this, but first and foremost among them is the fact that a majority of commercial “big data” is exquisitely structured and represents near complete data sets. For example, the record of credit card transactions at a major department store includes only credit card transactions at that department store, and not random string of numbers that might be UPC codes for fruits and vegetables at a cross-town grocery store. In contrast, intelligence data is either typically unstructured text captured in narrative form or arrives as a mixture of widely differing structures.
Furthermore, the nature of intelligence collection—the quest to obtain information on an adversary’s plans and intentions through a number of collection disciplines—all but ensures that the resulting data sets are “sparse,” representing only a small portion or sample of the larger picture from which they are drawn. The difficulty is that unlike the algorithm-based methods applied to commercial big data, it is impossible to know the bounds of the larger data set. Reliable and consistent inference of larger trends and patterns from a limited and unbounded data set is impossible.
This does not mean intelligence professionals cannot learn from and benefit from the commercial sector’s experiences with big data. Indeed, industry has a great deal to offer with respect to data conditioning and system architecture. These aspects of commercial systems designed to enable “big data” analysis will be critical to designing the specialized systems needed to deal with the more complex and sparse types of data used by intelligence analysts.
10.3.1 Collecting It “All”
While commercial entities with consistent data sets may have success using algorithmic prediction of patterns based on dense data sets, the key common methodology between “big data” and ABI is the shift away from sampling information at periodic intervals toward examining massive amounts of information abductively and deductively to identify correlations.
Cukier and Mayer-Schoenberger, in their assessment of the advantages of “n = all,” effectively argue for a move to a more deductive workflow based on data correlations, rather than causation based on sparse data. “n = all” and georeference to discover share the common intellectual heritage predicated on collecting all data in order to focus on correlations in a small portion of the dataset: Collect broadly, condition data, and enable the analyst to both explore and ask intelligence questions of the data.
The approach of “n = all” is the centerpiece of former NSA director general Keith Alexander’s philosophy of “collect it all.” According to a former senior U.S. intelligence official, “rather than look for a single needle in the haystack, his approach was, ‘Let’s collect the whole haystack. Collect it all, tag it, store it… and whatever it is you want, you go searching for it’
10.3.2 Object-Based Production (OBP)
In 2013, Catherine Johnston, director of analysis at the Defense Intelligence Agency (DIA), introduced object-based production (OBP), a new way of organizing information in the datafication paradigm. Recognizing the need to adapt to growing complexity with diminishing resources, OBP implements data tagging, knowledge capture, and reporting by “organizing intelligence around objects of interest”.
OBP addresses several shortfalls. Studies have found that known information was poorly organized, partially because information was organized and compartmented by the owner. Reporting was within INT-specific stovepipes. Further compounding the problem, target-based intelligence aligned around known facilities.
An object- and activity-based paradigm is more dynamic. It includes objects that move, vehicles and people, for which known information must be updated in real time. This complicates timely reporting on the status and location of these objects and creates a confusing situational awareness picture when conflicting information is reported from multiple information owners.
QUELLFIRE is the intelligence community’s program to deliver OBP as an enterprise service where “all producers publish to a unifying object model” (UOM) [27, p. 6]. Under QUELLFIRE, OBP objects are incorporated into the overall common intelligence picture (CIP)/common operating picture (COP) to provide situational awareness.
This focus means that the pedigree of the information is time-dominant and must be continually updated. Additional work on standards and tradecraft must be developed to establish a persistent, long-term repository of worldwide intelligence objects and their behaviors.
10.3.3 Relationship Between OBP and ABI
There has been a general confusion about the differences between OBP and ABI, stemming from the fact that both methods focus on similar data types and are recognized as evolutions in tradecraft. OBP, which is primarily espoused by DIA, the nation’s all-source military intelligence organization, is focused on order-of-battle analysis, technical intelligence on military equipment, the status of military forces, and battle plans and intentions (essentially organizing the known entities). ABI, led by NGA, began with a focus on integrating multiple sources of geospatial information in a geographic region of interest—evolving with the tradecraft of georeference to discover—to the discovery and resolution of previously unknown entities based on their patterns of life. This tradecraft produces new objects for OBP to organize, monitor, warn against, and report… OBP, in turn, identifies knowledge gaps, the things that are unknown that become the focus of the ABI deductive, discovery-based process. Efforts to meld the two techniques are aided by the IC-ITE cloud initiative, which colocates data and improves discoverability of information through common metadata standards.
10.4 The Future of Data and Big Data
Former CIA director David Petraeus highlighted the challenges and opportunities of the Internet of Things in a 2012 speech at In-Q-Tel, the agency’s venture capital research group: “As you know, whereas machines in the 19th century learned to do, and those in the 20th century learned to think at a rudimentary level, in the 21st century, they are learning to perceive—to actually sense and respond” [33]. He further highlighted some of the enabling technologies developed by In-Q-Tel investment companies, listed as follows:
• Item identification, or devices engaged in tagging;
• Sensors and wireless sensor networks—devices that indeed sense and respond;
• Embedded systems—those that think and evaluate;
• Nanotechnology, allowing these devices to be small enough to function virtually anywhere.
In his remarks at the GigaOM Structure:Data conference in New York in 2013, CIA chief technology officer (CTO) Hunt said, “It is nearly within our grasp to compute on all human generated information” [35]. This presents new challenges but also new opportunities for intelligence analysis.
11
Collection
Collection is about gathering data to answer questions. This chapter summarizes the key domains of intelligence collection and introduces new concepts and technologies that have codeveloped with ABI methods. It provides a high-level overview of several key concepts, describes several types of collection important to ABI, and summarizes the value of persistent surveillance in ABI analysis.
11.1 Introduction to Collection
Collection is the process of defining information needs and gathering data to address those needs.
The overarching term for remotely collected information is ISR (intelligence, surveillance, and reconnaissance).
The traditional INT distinctions are described as follows:
• Human intelligence (HUMINT): The most traditional “spy” discipline, HUMINT is “a category of intelligence derived from information collected and provided by human sources” [1]. This information is gathered through interpersonal contact; conversations, interrogations, or other like means.
• Signals intelligence (SIGINT): Intelligence gathering by means of intercepting of signals. In modern times, this refers primarily to electronic signals.
• Communications intelligence (COMINT): A subdiscipline of SIGINT, COMINT refers to the collection of signals that involve the communication between people, defined by the Department of Defense (DoD) as “technical information and intelligence derived from foreign communications by other than the intended recipients” [2]. COMINT exploitation includes language translation.
• Electronic intelligence (ELINT): A subdiscipline of SIGINT, ELINT refers to SIGINT that is not directly involved in communications. An example includes the detection of an early-warning radar installation by means of sensing emitted radio frequency (RF) energy. (This is not COMINT, because the radar isn’t carrying a communications channel).
• Imagery intelligence (IMINT): Information derived from imagery to include aerial and satellite-based photography. The term “IMINT” has generally been superseded by “GEOINT.”
• Geospatial intelligence (GEOINT): A term coined in 2004 to include “imagery, IMINT, and geospatial information” [3], the term GEOINT reflects the concepts of fusion, integration, and layering of information about the Earth.
• Measurement and signals intelligence (MASINT): Technical intelligence gathering based on unique collection phenomena that focus on specialized signatures of targets or classes of targets.
• Open-source intelligence (OSINT): Intelligence derived from public, open information sources. This includes but is not limited to newspapers, magazines, speeches, radio stations, blogs, video-sharing sites, social-networking sites, and government reports.
Each agency was to produce INT-specific expert assessments of collected information that was then forwarded to the CIA for integrative analysis called all-source intelligence. The ABI principle of data neutrality posits that all sources of information should be considered equally as a sources of intelligence.
There are a number of additional subdisciplines under these headings including technical intelligence (TECHINT), acoustic intelligence (ACINT), financial intelligence (FININT), cyber intelligence (CYBINT), and foreign instrumentation intelligence (FISINT) [4].
Despite thousands of airborne surveillance sorties during 1991’s Operation Desert Storm, efforts to reliably locate Iraq’s mobile SCUD missiles were unsuccessful [5]. The problem was further compounded during counterterrorism and counterinsurgency operations in Iraq and Afghanistan where the targets of intelligence collection are characterized by weak signals, ambiguous signatures and dynamic movement. The ability to capture movement intelligence (MOVINT) is one collection modality that contributes to ABI, because it allows direct observation of events and collection of complete transactions.
11.5 Collection to Enable ABI
Traditional collection is targeted, whether the target is a human, a signal, or a geographic location. Since ABI is about gathering all the data and analyzing it with a deductive approach, an incidental collection approach as described in Chapter 9 is more appropriate.
11.6 Persistence: The All-Seeing Eye (?)
For over 2,000 years, military tactics have encouraged the use of the “high ground” for surveillance and reconnaissance of the enemy. From the use of hills and treetops to the advent of military ballooning in the U.S. Civil War to aerial and space-based reconnaissance, nations jockey for the ultimate surveillance high ground. The Department of Defense defines “persistent surveillance” as “a collection strategy that emphasizes the ability of some collection systems to linger on demand in an area to detect, locate, characterize, identify, track, target, and possibly provide battle damage assessment and retargeting in near or real time”.
Popular culture often depicts persistent collection like the all-seeing “Eye of Sauron” in Peter Jackson’s Lord of the Rings trilogy, the omnipresent computer in “Eagle Eye,” or the camera-filled casinos of Ocean’s Eleven, but persistence for intelligence is less about stare and more about sufficiency to answer questions.
In this textbook, persistence is the ability to maintain sufficient frequency, duration, temporal resolution, and spectral resolution to detect change, characterize activity, and observe behaviors. This chapter summarizes several types of persistent collection and introduces the concept of virtual persistence—the ability to maintain persistence of knowledge on a target or set of targets through integration of multiple sensing and analysis modalities.
11.7 The Persistence “Master Equation”
Persistence, P, can be defined in terms of eight fundamental factors:
where
(x, y) is the area coverage usually expressed in square kilometers.
z is the altitude, positive or negative, from the surface of the Earth.
T is the total time, duration, or dwell.
f (or t) is the frequency, exposure time, or revisit rate.
λ is the wavelength (of the electromagnetic spectrum) or the collection phenomenology. Δλ may also be used to represent the discretization of frequency for multisensor collects, spectral sensors, or other means.
σ is the accuracy or precision of the collection or analysis.
θ is the resolution or distinguishability. θ may also express the quality of the information. Π is the cumulative probability, belief, or confidence in the information.
Combinations of these factors contribute to enhanced persistence.
12
Automated Activity Extraction
The New York Times reported that data scientists “spend from 50 to 80 percent of their time mired in this more mundane labor of collecting and preparing unruly digital data, before it can be explored for useful nuggets” [1]. Pejoratively referred to in the article as “janitor work,” these tasks, also referred to as data wrangling, data munging, data farming, and data conditioning, inhibit progress toward analysis [2]. Conventional wisdom and repeated interviews with data analytics professionals support the “80%” notion [3–5]. Many of these tasks are routine and repetitive: reformatting data into different coordinate systems or data formats; manually tagging objects in imagery and video; backtracking vehicles from destination to origin; and extracting entities and objects in text.
A 2003 study by DARPA in collaboration with several U.S. intelligence agencies found that analysts spend nearly 60% of their time performing research and preparing data for analysis [7]. The so-called bathtub curve, shown in Figure 12.1, shows how a significant percentage of an analyst’s time is spent looking for data (research), formatting it for analysis, writing reports, and working on other administrative tasks. The DARPA study examined whether advances in formation technology such as collaboration and analysis tools could invert the “bathtub curve” so that analysts would spend less time wrestling with data and more time collaborating and performing analytic tasks, finding a significant benefit from new IT-enhanced methods.
As the volume, velocity, and variety of data sources available to intelligence analysts explodes, the problem of the “bathtub curve” gets worse.
12.2 Data Conditioning
Data conditioning is an overarching term describing the preparation of data for analysis and is often associated with “automation” because it involves automated processes to prepare data for analysis.
Historically, the phrase “extract, transform, load” (ETL) referred to a series of basic steps to prepare data for consumption by databases and data services. Often, nuanced ETL techniques were tied to a specific database architecture. Data conditioning includes the following:
• Extracting or obtaining the source data from various heterogeneous data sources or identifying a streaming data source (e.g., RSS feed) that provides continuous data input;
• Reformatting the data so that it is machine-readable and compliant with the target data model;
• Cleaning the data to remove erroneous records and adjusting date/time formats or geospatial coordinate systems to ensure consistency;
• Translating the language of data records as necessary;
• Correcting the data for various biases (e.g., geolocation errors);
• Enriching the data by adding derived metadata fields from the original source data (e.g., enriching spatial data to include a calculated country code);
• Tagging or labeling data with security, fitness-for-use, or other structural tags;
• Georeferencing the data to a consistent coordinate system or known physical locations;
• Loading the data into the target data store consistent with the data model and physical structure of the store;
• Validating that the conditioning steps have been done correctly and that queries produce results that meet mission criteria.
Data conditioning of source data into a spatiotemporal reference frame enables georeference to discover.
While the principle of data neutrality promotes data conditioning from multiple sources, this chapter focuses on a subset of automated activity extraction techniques including automated extraction and geolocation of entities/events from text, extraction of objects/activities from still imagery, and automated extraction of objects, features, and tracks from motion imagery.
12.3 Georeferenced Entity and Activity Extraction
While many applications perform automated text-parsing and entity extraction from unstructured text files, the simultaneous automated extraction of geospatial coordinates is central to enabling the ABI tradecraft of georeference to discover.
Marc Ubaldino, systems engineer and software developer at the MITRE Corporation, described a project called Event Horizon (EH) that “was borne out of an interest in trying to geospatially describe a volume of data—a lot of data, a lot of documents, a lot of things—and put them on a map for analysts to browse, and search, and understand, the details and also the trends” [9]. EH is a custom-developed tool to enable georeference to discover by creating a shapefile database of text documents that are georeferenced to a common coordinate system.
. These simple tools are chained together to orchestrate data conditioning and automated processing steps. According to MITRE, these tools have “decreased the human effort involved in correlating multi-source, multi-format intelligence” [10, p. 47]. This multimillion records corpus of data was first called the “giant load of intelligence” (GLINT). Later, this term evolved to geolocated intelligence.
One implementation of this method is the LocateXT software by ClearTerra, a “commercial technology for analyzing unstructured documents and extracting coordinate data, custom place names, and other critical information into GIS and other spatial viewing platforms” [11]. The tool scans unstructured text documents and features a flexible import utility for structured data (spreadsheets, delimited text). The tool supports all Microsoft Office documents (Word, PowerPoint, Excel), Adobe PDF, XML, HTML, Text, and more. Some of the tasks performed by LocateXT are described as follows [12]:
• Extracting geocoordinates, user-defined place names, dates, and other critical information from unstructured data;
• Identifying and extracting thousands of variations of geocoordinate formats;
• Creating geospatial layers from extracted locations;
• Configuring place name extraction using a geospatial layer or gazetteer file;
• Creating custom attributes by configuring keyword search and extraction controls.
12.4 Object and Activity Extraction from Still Imagery
Extraction of objects, features, and activities from imagery is a core element of GEOINT tradecraft and central to training as an imagery analyst. A number of tools and algorithms have been developed to aid in the manual, computer-assisted, and fully automated extraction from imagery. Feature extraction techniques for geoprocessing buildings, roads, trees, tunnels, and other features are widely applied to commercial imagery and used by civil engineers and city planners.
Most facial recognition approaches follow a four-stage model:
Detect
→ Align
→ Represent
→ Classify.
Much research is aimed at the classify step of the workflow. Facebook’s approach improves performance by applying three-dimensional modeling to the alignment step and deriving the facial representation using a deep neural network.
While Facebook’s research applies to universal face detection, classification in the context of the problem set is significantly easier. When the Facebook algorithm attempts to recognize individuals in submitted pictures, it has information about the “friends” to which the user is currently linked (in ABI parlance, a combination of contextual and relational information). It is much more likely that an individual in a user-provided photograph is related to the user through his or her social network. This property, called local partitioning, is useful for ABI. If an analyst can identify a subset of the data that is related to the target through one or more links (for example, a history of spatial locations previously visited), the dimensionality of the wide area search and targeting problem can be exponentially reduced.
“Recognizing activities requires observations over time, and recognition performance is a function of the discrimination power of a set of observational evidence relative to the structure of a specific activity set” [45]. They highlight the importance of increasingly proliferating persistent surveillance sensors and focus on activities identified by a critical geospatial, temporal, or interactive pattern in highly cluttered environments.
12.6.6 Detecting Anomalous Tracks
Another automation technique that can be applied to wide area data is the detection of anomalous behaviors— that is, “individual tracks where the track trajectory is anomalous compared to a model of typical behavior”
12.7 Metrics for Automated Algorithms
One of the major challenges in establishing revolutionary algorithms for automated activity extraction, identification, and correlation is the lack of standards with which to evaluate performance. DARPA’s PerSEAS program introduced several candidate metrics that are broadly applicable across this class of algorithms…
12.8 The Need for Multiple, Complimentary Sources
In signal processing and sensor theory, the most prevalent descriptive plot is the receiver operating characteristic (ROC) curve, a plot of true positive rate or probability of detection versus FAR.
12.9 Summary
Speaking at the Space Foundation’s National Space Symposium in May 2014, DNI James Clapper said “We will have systems that are capable of persistence: staring at a place for an extended period of time to detect activity; to understand patterns of life; to warn us when a pattern is broken, when the abnormal happens; and even to use ABI methodologies to predict future actions”
The increasing volume, velocity, and variety of “big data” introduced in Chapter 10 requires implementation of automated algorithms for data conditioning, activity/event extraction from unstructured data, object/activity extraction from imagery, and automated detection/tracking from motion imagery.
On the other hand, “Deus ex machina,” Latin for “god from the machine,” is a term from literature when a seemingly impossible and complex situation is resolved with irrational or divine means. Increasingly sophisticated “advanced analytic” algorithms provide the potential to disconnect analysts from the data by simply placing trust in the “magical black box.” In practice, no analyst will trust any piece of data without documented provenance and without understanding exactly how it was collected or processed.
Automation also removes the analyst from the art of performing analysis. Early in the development of the ABI methodology, analysts were forced to do the dumpster diving and “data janitorial work” to condition their own data for analysis. In the course of doing so, analysts were close to each individual record, becoming intimately familiar with the metadata. Often, analysts stumbled upon anomalies or patterns in the course of doing this work. Automated data conditioning algorithms may reformat and “clean” data to remove outliers—but as any statistician knows—all the interesting behaviors are in the tails of the distribution.
13
Analysis and Visualization
Analysis of large data sets increasingly requires a strong foundation in statistics and visualization. This chapter introduces the key concepts behind data science and visual analytics. It demonstrates key statistical, visual, and spatial techniques for analysis of large-scale data sets. The chapter provides many examples of visual interfaces used to understand and analyze large data sets.
13.1 Introduction to Analysis and Visualization
Analysis is defined as “a careful study of something to learn about its parts, what they do, and how they are related to each other”
The core competency of the discipline of intelligence is to perform analysis, deconstructing complex mysteries to understand what is happening and why. Figure 13.1 highlights key functional terms for analysis and the relative benefit/effort required for each.
13.1.1 The Sexiest Job of the 21st Century…
Big-budget motion pictures seldom glamorize the careers of statisticians, operations researchers, and intelligence analysts. Analysts are not used to being called “sexy,” but in a 2012 article in the Harvard Business Review, Thomas Davenport and D. J. Patil called out the data scientist as “the sexiest job of the 21st century” [2]. The term was first coined around 2008 to recognize the emerging job roles associated with large-scale data analytics at companies like Google, Facebook, and LinkedIn. Combining the skills of a statistician, a computer scientist, and a software engineer, the proliferation of data science across commercial and government sectors recognizes that competitive organizations are deriving significant value from data analysis. Today we’re seeing an integration of data science and intelligence analysis, as intelligence professionals are being driven to discover answers in those giant haystacks of unstructured data.
According to Leek, Peng, and Caffo, the key tasks for data scientists are the following [4, p. 2].
• Defining the question;
• Defining the ideal data set;
• Obtaining and cleaning the data;
• Performing exploratory data analysis;
• Performing statistical prediction/modeling;
• Interpreting results;
• Challenging results;
• Synthesizing and writing up and distributing results.
Each of these tasks presents unique challenges. Often, the most difficult step of the analysis process is defining the question, which, in turn, drives the type of data needed to answer it. In a data-poor environment, the most time-consuming step was usually the collection of data; however, in a modern “big data” environment, a majority of analysts’ time is spent cleaning and conditioning the data for analysis. Many of the data sets—even publicly available ones—are seldom well-conditioned for instantaneous import and analysis. Often column headings, date formats, and even individual records may need reformatting before the data can even be viewed for the first time. Messy data is almost always an impetus to rapid analysis, and decision makers have little understanding of the chaotic data landscape experienced by the average data scientist.
13.1.2 Asking Questions and Getting Answers
The most important task for an intelligence analyst is determining what questions to ask. The traditional view of intelligence analysis places the onus of defining the question on the intelligence consumer, typically a policy maker.
Asking questions from a data-driven and intelligence problem–centric viewpoint is the central theme of this textbook and the core analytic focus for the ABI discipline. Sometimes, collected data limits the questions that may be asked. Unanswerable questions define additional data needs, either through collection of processing.
Analysis takes several forms, described as follows:
• Descriptive: Describe a set of data using statistical measures (e.g., census).
• Inferential: Develop trends and judgments about a larger population using a subset of data (e.g., exit polls).
• Predictive: Use a series of data observations to make predictions about the outcomes or behaviors of another situation (e.g., sporting event outcomes).
• Causal: Determine the impact on one variable when you change one more more variables (e.g., medical experimentation).
• Exploratory: Discover relationships and connections by examining data in bulk, sometimes without an initial question in mind (e.g., intelligence data).
Because the primary focus of ABI is discovery, the main branch of analysis applied in this textbook is exploratory analysis.
https://www.jmp.com/en_us/offers/statistical-analysis-software.html
13.2 Statistical Visualization
ABI analysis benefits from the combination of statistical processes and visualization. This section reviews some of the basic statistical functions that provide rapid insight into activities and behaviors.
13.2.1 Scatterplots
One of the most basic statistical tools used in data analysis and quality engineering is the scatterplot or scattergram, a two-dimensional Cartesian graph of two variables.
Correlation, discussed in detail in Chapter 14, is the statistical dependence between two variables in a data set.
13.2.2 Pareto Charts
Joseph Juran, a pioneer in quality engineering, developed the Pareto principle and named it after Italian economist Vilfredo Pareto. Also known as “the 80/20 rule,” the Pareto principle is a common rule of thumb that 80% of observations tend to come from 20% of the causes. In mathematics, this is manifest as a power law, also called the Pareto distribution whose cumulative distribution function is given as:
Where α, the Pareto index, is a number greater than 1 that defines the slope of the Pareto distribution. For an “80/20” power law, α ≈ 1.161. The power law curve appears in many natural processes, especially in information theory. It was popularized in Chris Anderson’s 2006 book The Long Tail: Why the Future of Business is Selling Less of More
A variation on the Pareto chart, called the “tornado chart,” is shown in Figure 13.6. Like the Pareto chart, bars indicate the significance of the contribution on the response but the bars are aligned about a central axis to show the direction of correlation between the independent and dependent variables.
Pareto charts are useful in formulating initial hypotheses about the possible dependence between two data sets or for identifying a collection strategy to reduce the standard error in a model. Statistical correlation using Pareto charts and the Pareto principle is one of the simplest methods for data-driven discovery of important relationships in real-world data sets.
13.2.3 Factor Profiling
Factor profiling examines the relationships between independent and dependent variables. The profiler in Figure 13.7 shows the predicted response (dependent variable) as each independent variable is changed while all others are held constant.
13.3 Visual Analytics
Visual analytics was defined by Thomas and Cook of the Pacific Northwest National Laboratory in 2005 as “the science of analytical reasoning facilitated by interactive visual interfaces” [8]. The emergent discipline combines statistical analysis techniques with increasingly colorful, dynamic, and interactive presentations of data. Intelligence analysts increasingly rely on software tools for visual analytics to understand trends, relationships and patterns in increasingly large and complex data sets. These methods are sometimes the only way to rapidly resolve entities and develop justifiable, traceable stories about what happened and what might happen next.
Large data volumes present several unique challenges. First, just transforming and loading the data is a cumbersome prospect. Most desktop tools are limited by the size of the data table that can be in memory, requiring partitioning before any analysis takes place. The a priori partitioning of a data set requires judgments about where the break points should be placed, and these may arbitrarily steer the analysis in the wrong direction. Large data sets also tend to exhibit “wash out” effects. The average data values make it very difficult to discern what is useful and what is not. In location data, many entities conduct perfectly normal transactions. Entities of interest exploit this effect to effectively hide in the noise.
As dimensionality increases, potential sources of causality and multivariable interactions also increase. This tends to wash out the relative contribution of each variable on the response. Again, another paradox arises: Arbitrarily limiting the data set means throwing out potentially interesting correlations before any analysis has taken place.
Analysts must take care to avoid visualization for the sake of visualization. Sometimes, the graphic doesn’t mean anything or reveal an interesting observation. Visualization pioneer Edward Tufte coined the term “chartjunk” to refer to these unnecessary visualizations in his 1983 book The Visual Display of Quantitative Information, saying:
The interior decoration of graphics generates a lot of ink that does not tell the viewer anything new. The purpose of decoration varies—to make the graphic appear more scientific and precise, to enliven the display, to give the designer an opportunity to exercise artistic skills. Regardless of its cause, it is all non-data-ink or redundant data-ink, and it is often chartjunk.
Michelle Borkin and Hanspeter Pfister of the Harvard School of Engineering and Applied Scientists studied over 5,000 charts and graphics from scientific papers, design blogs, newspapers, and government reports to identify characteristics of the most memorable ones. “A visualization will be instantly and overwhelmingly more memorable if it incorporates an image of a human-recognizable object—if it includes a photograph, people, cartoons, logos—any component that is not just an abstract data visualization,” says Pfister. “We learned that any time you have a graphic with one of those components, that’s the most dominant thing that affects the memorability”
13.4 Spatial Statistics and Visualization
the concept of putting data on a map to improve situational awareness and understanding may seem trite, but the first modern geospatial computer system was not proposed until 1968. While working for the Department of Forestry and Rural Development for the Government of Canada, Roger Tomlinson introduced the term “geographic information system” (now GIS) as a “computer-based system for the storage and manipulation of map-based land data”
13.4.1 Spatial Data Aggregation
A popular form of descriptive analysis using spatial statistical is the use of subdivided maps based on aggregated data. Typical uses include visualization of census data by tract, county, state, or other geographic boundaries.
Using a subset of data to made judgments about a larger population is called inferential analysis.
13.4.2 Tree Maps
Figure 13.10 shows a tree map of spatial data related to telephone call logs for a business traveler.1 A tree map is a technique for visualizing categorical, hierarchical data with nested rectangles
In the Map of the Market, the boxes are categorized by industry, sized by market capitalization, and colored by the change in the stock price. A financial analyst can instantly see that consumer staples are down and basic materials are up. The entire map turns red during a broad sell-off. Variations on the Map of the Market segment the visualization by time so analysts can view data in daily, weekly, monthly, or 52-week increments.
The tree map is a useful visualization for patterns—in this case transactional patterns categorized by location and recipient. The eye is naturally drawn to anomalies in color, shape, and grouping. These form the starting point for further analysis of activities and transactions, postulates of relationships between data elements, and hypothesis generation about the nature of the activities and transactions as illustrated above. While tree maps are not inherently spatial, this application shows how spatial analysis can be incorporated and how the spatial component of transactional data generates new questions and leads to further analysis.
This type of analysis reveals a number of other interesting things about the entity (and related entities) patterns of life elements. If all calls contain only two entities, then when entity A calls entity B, we know that both entities are (likely) not talking to someone else during that time.
13.4.3 Three-Dimensional Scatterplot Matrix
Three-dimensional colored dot plots are widely used in media and scientific visualization because they are complex and compelling. Although it seems reasonable to extend two-dimensional visualizations to three dimensions, these depictions are often visually overwhelming and seldom convey additional information that cannot be viewed using a combination of two-dimensional plots more easily synthesized by humans.
GeoTime is a spatial/temporal visualization tool that plays back spatially enabled data like a movie. It allows analysts to watch entities move from one location to another and interact through events and transactions. Patterns of life are also easily evident in this type of visualization.
Investigators and lawyers use GeoTime in criminal cases to show the data-driven story about an entity’s pattern of movements and activities
13.4.4 Spatial Storytelling
The latest technique incorporated into multi-INT tradecraft and visual analytics is the aspect of spatial storytelling: using data about time and place to animate a series of events. Several statistical analysis tools implemented storytelling or sequencing capabilities
Online spatial storytelling communities have developed as collaborative groups of data scientists and geospatial analysts combine their tradecraft with increasingly proliferated spatially-enabled data. The MapStory Foundation, a 501(c)3 educational organization founded in 2011 by social entrepreneur Chris Tucker developed an open, online platform for sharing stories about our world and how it develops over time.
13.5 The Way Ahead
Visualizing relationships across large, multidimensional data sets quickly requires more real estate than the average desktop computer. NGA’s 24-hour operations center, with a “knowledge wall” comprised of 56 eighty-inch monitors, was inspired by the television show “24”
There are several key technology areas that provide potential for another paradigm shift in how analysts work with data. Some of the benefits of these technological advances were highlighted by former CIA chief technology officer Gus Hunt at a 2010 forum on big data analytics:
Elegant, powerful, and easy-to-use tools and visualizations;
• Intelligent systems that learn from the user;
• Machines to do more of the heavy lifting;
• A move to correlation, not search;
• A “curiosity layer”—signifying machines that are curious on your behalf.
14
Correlation and Fusion
Correlation of multiple sources of data is central to the integration before exploitation pillar of ABI and was the first major analytic breakthrough in combating adversaries that lack signature and doctrine.
Fusion, whether accomplished by a computer or a trained analyst, is central to this task. The suggested readings for this chapter alone fill several bookshelves.
Data fusion has evolved over 40 years into a complete discipline in its own right. This chapter provides a high-level overview of several key concepts in the context of ABI processing and analysis while directing the reader to further detailed references on this ever evolving topic.
14.1 Correlation
Correlation is the tendency of two variables to be related to each other. ABI relies heavily on correlation between multiple sources of information to understand patterns of life and resolve entities. The terms “correlation” and “association” are closely related.
A central principle of ABI is the need to correlate data from multiple sources—data neutrality—without a priori regard for the significance of data. In ABI, correlation leads to discovery of significance.
Scottish philosopher David Hume, in his 1748 book An Enquiry Concerning Human Understanding, defined association in terms of resemblance, contiguity [in time and place], and causality Hume says, “The thinking on any object readily transports the mind to what is contiguous”—an eighteenth-century statement of georeference to discover [1].
14.1.1 Correlation Versus Causality
One of the most oft-quoted maxims in data analysis is “correlation does not imply causality.
Many doubters of data science and mathematics use this sentence to deny any analytic result, dismissing a statistically valid fact as “pish posh.” Correlation can be a powerful indicator of possible causality and a clue for analysts and researchers to continue an investigative hypothesis.
In Thinking, Fast and Slow, Kahneman notes that we “easily think associatively, we think metaphorically, we think causally, but statistics requires thinking about many things at once,” which is difficult for humans to do without great effort.
The only way to prove causality is through controlled experiments where all external influences are carefully controlled and their responses measured. The best example of controlled evaluation of causality is through pharmaceutical trials, where control groups, blind trials, and placebos are widely used.
In the discipline of intelligence, the ability to prove causality is effectively zero. Subjects of analysis are seldom participatory. Information is undersampled, incomplete, intermittent, erroneous, and cluttered. Knowledge lacks persistence. Sensors are biased. The most important subjects of analysis are intentionally trying to deceive you. Any medical trial conducted under these conditions would be laughably dismissed.
Remember: correlations are clues and indicators to dig deeper. Just as starts and stops are clues to begin transactional analysis at a location, the presence of a statistical correlation or a generic association between two factors is a hint to begin the process of deductive or abductive analysis there. Therefore, statistical analysis of data correlation is a powerful tool to combine information from multiple sources through valid, justifiable mathematical relationships, avoiding the human tendency to make subjective decisions based on known, unavoidable, irrational biases.
14.2 Fusion
The term “fusion” refers to “the process or result of joining two or more things together to form a single entity” [6]. Waltz and Llinas introduce the analogy of the human senses, which readily and automatically combine data from multiple perceptors (each with different measurement characteristics) to interpret the environment.
Fusion is the process of disambiguating of two or more objects, variables, measurements, or entities that asserts—with a defined confidence value—that the two elements are the same. Simply put, the difference between correlation and fusion is that correlation says “these two elements are related.” Fusion says “these two objects are the same.”
Data fusion “combines data from multiple sensors and related information to achieve more specific inferences than could be achieved by using a single, independent sensor”
The evolution of data fusion methods since the 1980s recognizes that fusion of information to improve decision making is a central process in many human endeavors, especially intelligence. Data fusion has been recognized as a mathematical discipline in its own right, and numerous conferences and textbooks have been dedicated to the subject.
The mathematical techniques for data fusion can be applied to many problems in information theory such as intelligence analysis and ABI. They highlight the often confusing terminology used by multiple communities (see Figure 14.1) that rely on similar mathematical techniques with related objectives. Target tracking, for example, is a critical enabler for ABI but is only a small subset of the techniques in data fusion and information fusion.
14.2.1 A Taxonomy for Fusion Techniques
Recognizing that “developing cost-effective multi-source information systems requires a standard method for specifying data fusion processing and control functions, interfaces, and associated databases,” the Joint Directors of Laboratories (JDL) proposed a general taxonomy for data fusion systems in the 1980s.
The fusion levels defined by the JDL are as follows:
• Source preprocessing, sometimes called level 0 processing, is data association and estimation below the object level. This step was added to the three-level model to reflect the need to combine elementary data (pixel level, signal level, character level) to determine an object’s characteristics. Detections are often categorized as level 0.
• Level 1 processing, object refinement, combines sensor data to estimate the attributes or characteristics of an object to determine position, velocity, trajectory, or identity. This data may also be used to estimate the future state of the object. Hall and Llinas include sensor alignment, association, correlation, correlation/tracking, and classification in level 1 processing [11].
• Level 2 processing, situation refinement, “attempts to develop a description of current relationships among entities and events in the context of their environment” [8, p. 9]. Contextual information about the object (e.g., class of object and kinematic properties), the environment (e.g., the object is present at zero altitude in a body of water), or other related objects (e.g., the object was observed coming from a destroyer) refines state estimation of the object. Behaviors, patterns, and normalcy are included in level 2 fusion.
• Level 3 processing, threat refinement or significance estimation, is a high-level fusion process that characterizes the object and draws inferences in the future based on models, scenarios, state information, and constraints. Most advanced fusion research focuses on reliable level 3 techniques. This level includes prediction of future events and states.
• Level 4 processing, process refinement, augmented the original model by recognizing that continued observations can feed back into fusion and estimation processes to improve overall system performance. This can include multiobjective optimization or new techniques to fuse data when sensors operate on vastly different timescales [12, p. 12].
• Level 5 processing, cognitive refinement or human/computer interface, recognizes the role of the user in the fusion process. Level 5 includes approaches for fusion visualization, cognitive computing, scenario analysis, information sharing, and collaborative decision making. Level 5 is where the analyst performs correlation and fusion for ABI.
The designation as “levels” may be confusing to apprentices in the field as there is no direct correlation to the “levels of knowledge” associated with knowledge management. The JDL fusion levels are more accurately termed categories; a single piece of information does not have to traverse all five “levels” to be considered fused.
According to Hall and Llinas, “the most mature area of data fusion process is level 1 processing,” and a majority of applications fall into or include this category. Level 1 processing relies on estimation techniques such as Kalman filters, MHT, or joint probabilistic data association.
Data fusion applications for detection, identification, characterization, extraction, location, and tracking of individual objects fall in level 1. Additional higher level techniques that consider the behaviors of that object in the context of its surroundings and possible courses of action are techniques associated with levels 2 and 3. These higher level processing methods are more akin to analytic “sensemaking” performed by humans, but computational architectures that perform mathematical fusion calculations may be capable of operating with greatly reduced decision timelines. A major concern of course is turning what amounts to decision authority to silicon-based processors and mathematical algorithms, especially when those algorithms are difficult to calibrate.
14.2.2 Architectures for Data Fusion
The voluminous literature on data fusion includes several architectures for data fusion that follow the same pattern. Hall and Llinas propose three alternatives:
1. “Direct fusion of sensor data;
2. Representation of sensor data via feature vectors, with subsequent fusion of the feature vectors;
3. Processing of each sensor to achieve high-level inferences or decisions, which are subsequently combined [8].”
14.3 Mathematical Correlation and Fusion Techniques
Most architectures and applications for multi-INT fusion, at their cores, rely on various mathematical techniques for conditional probability assessment, hypothesis management, and uncertainty quantification/propagation. The most basic and widely used of these techniques, Bayes’s theorem, Dempster-Shafer theory, and belief networks, are discussed in this section.
14.3.1 Bayesian Probability and Application of Bayes’s Theorem
One of the most widely used techniques in information theory and data fusion is Bayes’s theorem. Named after English clergyman Thomas Bayes who first documented it in 1763, the relation is statement of conditional probability and its dependence on prior information. Bayes’s theorem calculates the probability of an event, A, given information about event B and information about the likelihood of one event given the other. The standard form of Bayes’s theorem is given as:
where
P(A) is the prior probability, that is, the initial degree of belief in event A;
P(A|B) is the conditional probability of A given that event B occurred (also called the posterior probability in Bayes’s theorem);
P(B|A) is the conditional probability of B, given that event A occurred, also called the likelihood; P(B) is the probability of event B.
This equation is sometimes generalized as:
or, said as “the posterior is proportional to the likelihood times the prior” as:
Sometimes, Bayes’s theorem is used to compare two competing statements or hypotheses, and given as the form:
where P(¬A) is the probability of the initial belief against event A, or 1–P(A), and P(B|¬A) is the conditional probability or likelihood of B given that event A is false.
Taleb explains that this type of statistical thinking and inferential thinking is not intuitive to most humans due to evolution: “consider that in a primitive environment there is no consequential difference between the statements most killers are wild animals and most wild animals are killers”
In the world of prehistoric man, those who treated these statements as equivalent probably increased their probability of staying alive. In the world of statistics, these are two different statements that can be represented probabilistically. Bayes’s theorem is useful in calculating quantitative probabilities of events based on observations of other events, using the property of transitivity and priors to calculate unknown knowledge from that which is known. In ABI, it is used to formulate a probability-based reasoning tree for observable intelligence events.
Application of Bayes’s Theorem to Object Identification
The frequency or rarity of the objects in step 1 of Figure 14.7 is called the base rate. Numerous studies of probability theory and decision-making show that humans tend to overestimate the likelihood of events with low base rates. (This tends to explain why people gamble). Psychologists Amos Tversky and Daniel Kahneman refer to the tendency to overestimate salient, descriptive, and vivid information at the expense of contradictory statistical information as the representativeness heuristic [15].
The CIA examined Bayesian statistics in the 1960s and 1970s as an estimative technique in a series of articles in Studies in Intelligence. An advantage of the method noted by CIA researcher, Jack Zlotnick is that the analyst makes “sequence of explicit judgments on discrete units” of evidence rather than “a blend of deduction, insight, and inference from the body of evidence as a whole” [16]. He notes, “The research findings of some Bayesian psychologists seem to show that people are generally better at appraising a single item of evidence than at drawing inferences from the body of evidence considered in the aggregate” [17].
The process for Bayesian combination of probability distributions from multiple sensors to produce a fused entity identification is shown in Figure 14.8. Each individual sensor produces a declaration matrix, which is that sensor’s declarative view object’s identity based on its attributes—sensed characteristics, behaviors, or movement properties. The individual probabilities are combined jointly using the Bayesian formula. Decision logic is applied to select the MAP that represents the highest probabilities of correct identity. Decision rules can also be applied to threshold the MAP based on constraints or to apply additional deductive logic from other fusion processes. The resolved entity is declared (with an associated probability). When used with a properly designed multisensor data management system, this declaration maintains provenance back to the original sensor data.
Bayes’s formula provides a straightforward, easily programmed mathematical formulation for probabilistic combination of multiple sources of information; however, it does not provide a straightforward representation for a lack of information. A modification of Bayesian probability called Dempster-Shafer theory introduces additional factors to address this concern.
14.3.2 Dempster-Shafer Theory
Dempster-Shafer theory is a generalization of Bayesian probability based on the integration of two principles. The first is belief functions, which allow for the determination of belief from one question on the subjective probabilities for a related question. The degree to which the belief is transferrable depends on how related the two questions are and the reliability of the source [18]. The second principle is Dempster’s composition rule, which allows independent beliefs to be combined into an overall belief about each hypothesis [19]. According to Shafer, “The theory came to the attention of artificial intelligence (AI) researchers in the early 1980s, when they were trying to adapt probability theory to expert systems” [20]. Dempster-Shafer theory differs from the Bayesian approach in that the belief in a fact and the opposite of that fact does not need to sum to 1; that is, the method accounts for the possibility of “I don’t know.” This is a useful property for multisource fusion especially in the intelligence domain.
Multisensor fusion approaches use Dempster-Shafer theory to discriminate objects by treating observations from multiple sensors as belief functions based on the object and properties of the sensor. Instead of combining conditional probabilities for object identification as shown in Figure 14.8, the process for fusion proposed by Waltz and Llinas is modified for the Dempster-Shafer approach in Figure 14.9. Mass functions replace conditional probabilities, and Dempster’s combination rule accounts for the additional uncertainty when the sensor cannot resolve the target. The property of normalization by the null hypothesis is also important because it removes the incongruity associated with sensors that disagree.
Although this formulation adds more complexity, it is still easily programmed into a multisensor fusion system. The Dempster-Shafer technique can also be easily applied to quantify beliefs and uncertainty for multi-INT analysis including the beliefs of members of an integrated analytic working group.
In plain English, (14.10) says, “The joint belief in hypothesis H given evidence E1 and E2 is the sum of 1) the belief in H given confirmatory evidence from both sensors, 2) the belief in H given confirmatory evidence from sensor 1 [GEOINT] but with uncertainty about the result from sensor 2, and 3) the belief in H given confirmatory evidence from sensor 2 [SIGINT] but with uncertainty about the result from sensor 1.”
The final answer is normalized to remove dissonant values by dividing each belief by (1-d). The final beliefs are the following:
• Zazikistan is under a coup = 87.9%;
• Zazikistan is not under a coup = 7.8%;
• Unsure = 4.2%;
• Total = 100%.
Repeating the steps above, substituting E1*E2 for the first belief and E3 as the second belief, Dempster’s rule can again be used to combine the beliefs for the three sensors:
• Zazikistan is under a coup = 95.3%;
• Zazikistan is not under a coup = 4.2%;
• Unsure = 0.5%;
• Total = 100%.
In this case, because the HUMINT source has only contributes 0.2 toward the belief in H, the probability that Zazikistan is under a coup actually decreases slightly. Also, because this source has a reasonably low value of u, the uncertainty was further reduced.
While the belief in the coup hypothesis is 92.7%, the plausibility is slightly higher because the analyst must consider the belief in hypothesis H as well as the uncertainty in the outcome. The plausibility of a coup is 93%. Similarly, the plausibility in Hc also requires addition of the uncertainty: 7.3%. These values sum to greater than 100% because the uncertainty between H and Hc makes either outcome equally likely in the rare case that all four sensors produce faulty evidence.
14.3.3 Belief Networks
A belief network2 is a “a probabilistic graphical model (a type of statistical model) that represents a set of random variables and their conditional dependencies via a directed acyclic graph (DAG)” [22]. This technique allows chaining of conditional probabilities—calculated either using Bayesian theory or Dempster-Shafer theory—for a sequence of possible events. In one application, Paul Sticha and Dennis Buede of HumRRO and Richard Rees of the CIA developed APOLLO, a computational tool for reasoning through a decision-making process by evaluating probabilities in Bayesian networks. Bayes’s rule is used to multiply conditional probabilities across each edge of the graph to develop an overall probability for certain outcomes with the uncertainty for each explicitly quantified.
14.4 Multi-INT Fusion For ABI
Correlation and fusion is central to the analytic tradecraft of ABI. One application of multi-INT correlation is to use the strengths of one data source to compensate for the weaknesses in another. SIGINT, for example, is exceptionally accurate in verifying identity through proxies because many signals have unique identifiers that are broadcast in the signal like the Maritime Mobile Service Identity (MMSI) in the ship-based navigation system, AIS. Signals also may include temporal information, but SIGINT is accurate in the temporal domain because radio waves propagate at the speed of light—if sensors are equipped with precise timing capabilities, the exact time of the signal emanation is easily calculated. Unfortunately, because direction-finding and triangulation are usually required to locate the point of origin, SIGINT has measurable but significant errors in position (depending on the properties of the collection system). GEOINT on the other hand is exceptionally accurate in both space and time. A GEOINT collection platform knows when and where it was when it passively collected photons coming off a target. This error can be easily propagated to the ground using a sensor model.
The ability to correlate results of wide area collection with precise, entity resolving, narrow field-of-regard collection systems is an important use for ABI fusion and an area of ongoing research.
Hard/soft fusion is a promising area of research that enables validated correlation of information from structured remote sensing assets with human-focused data sources including the tacit knowledge of intelligence analysts. Gross et al. developed a framework for fusing hard and soft data under a university research initiative that included ground-based sensors, tips to law enforcement, and local news reports [28]. The University at Buffalo (UB) Center for Multisource Information Fusion (CMIF) is the leader of a multi-university research initiative (MURI) developing “a generalized framework, mathematical techniques, and test and evaluation methods to address the ingestion and harmonized fusion of hard and soft information in a distributed (networked) Level 1 and Level 2 data fusion environment”
14.5 Examples of Multi-INT Fusion Programs
In addition to numerous university programs developing fusion techniques and frameworks, automated fusion of multiple sources is an area of ongoing research and technology development, especially at DARPA, federally funded research and development corporations (FFRDCs), and the national labs.
14.5.1 Example: A Multi-INT Fusion Architecture
Simultaneously, existing knowledge from other sources (in the form of node and link data) and tracking of related entities is combined through association analysis to produce network information. The network provides context to the fused multi-INT entity/object tracks to enhance entity resolution. Although entity resolution can be performed at level 2, this example highlights the role of human-computer interaction (level 5 fusion) in integration-before-exploitation to resolve entities. Finally, feedback from the fused entity/object tracks is used to retask GEOINT resources for collection and tracking in areas of interest.
14.5.2 Example: The DARPA Insight Program
In 2010, DARPA instituted the Insight program to address a key shortfall for ISR systems: “the lack of a capability for automatic exploitation and cross-cueing of multi-intelligence (multi-INT) sources
Methods like Bayesian fusion and Dempster-Shafer theory are used to combine new information inputs from steps 3, 4, 7, and 8. Steps 2 and 6 involve feedback to the collection system based on correlation and analysis to obtain additional sensor-derived information to update object states and uncertainties.
The ambitious program seeks to “automatically exploit and cross-cue multi-INT sources” to improve decision timelines and automatically collect the next most important piece of information to improve object tracks, reduce uncertainty, or anticipate likely courses of action based on models of the threat and network.
14.6 Summary
Analysts practice correlation and fusion in their workflows—the art of multi-INT. However, there are numerous mathematical techniques for combining information with quantifiable precision. Uncertainty can be propagated through multiple calculations, giving analysts a hard, mathematically rigorous measurement of multisource data. The art and science of correlation do not play well together, and the art often wins over the science. Most analysts prefer to correlate information they “feel” is related. Efforts to integrate structured mathematical techniques with the human-centric process of developing judgments must be developed. Hybrid techniques that quantify results with science but leave room for interpretation may advance the tradecraft but are not widely used in ABI today.
15
Knowledge Management
Knowledge is value-added information that is integrated, synthesized, and contextualized to make comparisons, assess outcomes, establish relationships, and engage decision-makers in discussion. Although some texts make a distinction between data, information, knowledge, wisdom, and intelligence, we define knowledge as the totality of understanding gained through repeated analysis and synthesis of multiple souces of information over time. Knowledge is the essence of an intelligence professional and is how he or she answers questions about key intelligence issues. This chapter introduces elements of the wide-ranging discipline of knowledge management in the context of ABI tradecraft and analytic methods. Concepts for capturing tacit knowledge, linking data using dynamic graphs, and sharing intelligence across a complex, interconnected enterprise are discussed.
15.1 The Need for Knowledge Management
Knowledge management is a term that first appeared in the early 1990s, recognizing that the intellectual capital of an organization provided competitive advantage and must be managed and protected. Knowledge management is a comprehensive strategy to get the right information to the right people at the right time so they can do something about it. So-called intelligence failures seldom stem from the inability to collect information, but rather the ability to integrate intelligence with sufficient confidence to make decisions that matter.
Gartner’s Duhon defines knowledge management (KM) as:
a discipline that promotes an integrated approach to identifying, capturing, evaluating, retrieving, and sharing all of an enterprise’s information assets. These assets may include databases, documents, policies, procedures, and previously un-captured expertise and experience in individual workers [4].
This definition frames the discussion in this chapter. The ABI approach treats data and knowledge as an asset— and the principle of data neutrality says that all these assets should be considered as equally “important” in the analysis and discovery process. Some knowledge management approaches are concerned with knowledge capture, that is, the institutional retention of intellectual capital possessed by retiring employees. Others are concerned with knowledge transfer, the direct conveyance of such a body of knowledge from older to younger workers through observation, mentoring, comingling, or formal apprenticeships. Much of the documentation in the knowledge management field focuses on methods for interviewing subject matter experts or eliciting knowledge through interviews. While these are important issues in the intelligence community, “increasingly, the spawning of knowledge involves a partnership between human cognition and machine-based intelligence”.
15.1.1 Types of Knowledge
Knowledge is usually categorized into two types, explicit and tacit knowledge. Explicit knowledge is that which is formalized and codified. This is sometimes called “know what” and is much easier to document, store, retrieve, and manage. Knowledge management systems that focus only on the storage and retrieval of explicit knowledge are more accurately termed information management systems, as most explicit knowledge is stored in databases, memos, documents, reports, notes, and digital data files.
Tacit knowledge is intuitive knowledge based on experience, sometimes called “know-how.” Tacit knowledge is difficult to document, quantify, and communicate to another person. This type of knowledge is usually the most valuable in any organization. Lehaney notes that the only sustainable competitive advantage and “the locus of success in the new economy is not in the technology, but in the human mind and organizational memory” [6, p. 14]. Tacit knowledge is intensely contextual and personal. Most people are not aware of the tacit knowledge they inherently possess and have a difficult time quantifying what they “know” outside of explicit facts.
In the intelligence profession, explicit knowledge is easily documented in databases, but of greater concern is the ability to locate, integrate, and disseminate information held tacitly by experienced analysts. ABI requires analytic mastery of explicit knowledge about an adversary (and his or her activities and transactions) but also requires tacit knowledge of an analyst to understand why the activities and transactions are occurring.
While many of the methods in this textbook refer to the physical manipulation of explicit data, it is important to remember the need to focus on the “art” of multi-INT spatiotemporal analytics. Analysts exposed to repeated patterns of human activity develop a natural intuition to recognize anomalies and understand where to focus analytic effort. Sometimes, this knowledge is problem-, region-, or group-specific. More often than not, individual analysts have a particular knack or flair for understanding activities and transactions of certain types of entities. Often, tacit knowledge provides the turning point in a particularly difficult investigation or unravels the final clue in a particularly difficult intelligence mystery, but according to Meyer and Hutchinson, individuals tend to place more weight on concrete and vivid information over that which is intangible and ambiguous [7, p. 46]. Effectively translating ambiguous tacit knowledge like feelings and intuition into explicit information is critical in creating intelligence assessments. This is the primary paradox of tacit knowledge; it often has the greatest value but is the most difficult to elicit and apply.
Amassing facts rarely leads to innovative and creative breakthroughs. The most successful organizations are those that can leverage both types of knowledge for dissemination, reproduction, modification, access, and application throughout the organization.
15.2 Discovery of What We Know
As the amount of information available continues to grow, knowledge workers spend an increasing amount of their day messaging, tagging, creating documents, searching for information, and performing queries and other information-focused activities [9, p. 114]. New concepts are needed to enhance discovery and reduce the entropy associated with knowledge management.
15.2.1 Recommendation Engines
Content-based filtering identifies items based on an analysis of the item’s content as specified in metadata or description fields. Parsing algorithms extract common keywords to build a profile for each item (in our case, for each data element or knowledge object). Content-based filtering systems generally do not evaluate the quality, popularity, or utility of an item.
In collaborative filtering, “items are recommended based on the interests of a community of users without any analysis of item content” [10]. Collaborative filtering ties interest in items to particular users that have rated those items. This technique is used to identify similar users: the set of users with similar interests. In the intelligence case, these would be analysts with an interest in similar data.
A key to Amazon’s technology is the ability to calculate the related item table offline, storing this mapping structure, and then efficiently using this table in real time for each user based on current browsing history. This process is described in Figure 15.1. Items the customer has previously purchased, favorably reviewed, or items currently in the shopping cart are treated with greater affinity than items browsed and discarded. The “gift” flag is used to identify anomalous items purchased for another person with different interests so these purchases do not skew the personalized recommendation scheme.
In ABI knowledge management, knowledge about entities, locations, and objects is available through object metadata. Content-based filtering identifies similar items based on location, proximity, speed, or activities in space and time. Collaborative filtering can be used to discover analysts working on similar problems based on their queries, downloads, and exchanges of related content. This is an internal application of the “who-where” tradecraft, adding additional metadata into “what” the analysts are discovering and “why” they might need it.
15.2.2 Data Finds Data
An extension of the recommendation engine concept to next-generation knowledge management is an emergent concept introduced by Jeff Jonas and Lisa Sokol called “data finds data.” In contrast to traditional query-based information systems, Jonas and Sokol posit that if the system knew what the data meant, it would change the nature of data discovery by allowing systems to find related data and therefore interested users. They explain:
With interest in a soon-to-be-released book, a user searches Amazon.com for the title, but to no avail. The user decides to check every month until the book is released. Unfortunately for the user, the next time he checks, he finds that the book is not only sold out but now on back order, awaiting a second printing. When the data finds the data, the moment this book is available, this data point will discover the user’s original query and automatically email the user about the book’s availability.
Jonas, now chief scientist at IBM’s entity analytics group joined the firm after Big Blue acquired his company, SRD, in 2005. SRD developed data accumulation and alerting systems for Las Vegas casinos including non-obvious relationship analysis (NORA), famous for breaking the notorious MIT card counting ring in the best-selling book Bringing Down the House [12]. He postulates that knowledge-rich but discovery-poor organizations derive increasing wealth from connecting information across previously disconnected information silos using real-time “perpetual analytics” [13]. Instead of processing data using large bulk algorithms, each piece of data is examined and correlated on ingest for its relationship to all other accumulated content and knowledge in the system. Such a context-aware data ingest system is a computational embodiment of integrate before exploit, as each new piece of data is contextualized, sequence-neutrally of course, with the existing knowledge corpus across silos. Jonas says, “If a system does not assemble and persistent context as it comes to know it… the computational costs to reconstruct context after the facts are too high”
Jonas elaborated on the implication of these concepts in a 2011 interview after the fact: “There aren’t enough human beings on Earth to think of every smart question every day… every piece of data is the question. When a piece of data arrives, you want to take that piece of data and see how it relates to other pieces of data. It’s like a puzzle piece finding a puzzle” [15, 16]. Treating every piece of data as the question means treating data as queries and queries as data.
15.2.3 Queries as Data
Information requests and queries are themselves a powerful source of data that can be used to optimize knowledge management systems or assist the user in discovering content.
15.3 The Semantic Web
The semantic web is a proposed evolution of the World Wide Web from a document-based structured designed to be read by humans to a network of hyperlinked, machine-readable web pages that contain metadata about the content and how multiple pages are related to each other. The semantic web is about relationships.
Although the original concept was proposed in the 1960s, the term “semantic web” and its application to an evolution of the Internet was popularized by Tim Berners-Lee in a 2001 article in Scientific American. He posits that the semantic web “will usher in significant new functionality as machines become much better able to process and ‘understand’ the data that they merely display at present” [18].
The semantic web is based on several underlying technologies, but the two basic and powerful ones are the extensible markup language (XML) and the resource description framework (RDF).
15.3.1 XML
XML is a World Wide Web Consortium (W3C) standard for encoding documents that is both human-readable and machine-readable [19].
XML can also be used to create relational structures. Consider the example shown below where there are two data sets consisting of locations (locationDetails) and entities (entityDetails) (adapted from [20]):
<locationDetails>
<location ID=”L1”>
<cityName>Annandale</cityName>
<stateName>Virginia</stateName>
</location ID>
<location ID=”L2”>
<cityName>Los Angeles</cityName>
<stateName>California</stateName>
</location ID>
</locationDetails>
<entityDetails>
<entity locationRef=”L1”>
<entityName>Patrick Biltgen</entityName>
</entity>
<entity locationRef=”L2”>
<entityName>Stephen Ryan</entityName>
</entity>
</entityDetails>
Instead of including the location of each entity as an attribute within entityDetails, the structure above links each entity to a location using the attribute locationRef. This is similar to how a foreign key works in a relational database. One advantage to using this structure is that the two entities can be linked to multiple locations, especially when their location is a function of time and activity.
XML is a flexible, adaptable resource for creating documents that are context-aware and can be machine parsed using discovery and analytic algorithms.
15.4 Graphs for Knowledge and Discovery
Graphs are a mathematical construct consisting of nodes (vertices) and edges that connect them. .
Problems can be represented by graphs and analyzed using the discipline of graph theory. In information systems, graphs represent communications, information flows, library holdings, data models, or the relationships in a semantic web. In intelligence, graph models are used to represent processes, information flows, transactions, communications networks, order-of-battle, terrorist organizations, financial transactions, geospatial networks, and the pattern of movement of entities. Because of their widespread applicability and mathematical simplicity, graphs provide a powerful construct for ABI analytics.
Graphs are drawn with dots or circles representing each node and an arc or line between nodes to represent edges as shown in Figure 15.3. Directional graphs use arrows to depict the flow of information from one node to another. When graphs are used to represent semantic triplestores, the direction of the arrow indicates the direction of the relationship or how to read the simple sentence. Figure 5.8 introduced a three-column framework for documenting facts, assessments, and gaps. This information is depicted as a knowledge graph in Figure 15.3. Black nodes highlight known information, and gray nodes depict knowledge gaps. Arrow shading differentiates facts from assessments and gaps. Shaded lines show information with a temporal dependence like the fact that Jim used to live somewhere else (a knowledge gap because we don’t know where). Implicit relationships can also be documented using the knowledge graph: Figure 5.8 contains the fact “the coffee shop is two blocks away from Jim’s office.”
The knowledge graph readily depicts knowns and unknowns. Because this construct can also be depicted using XML tags or RDF triples, it also serves as a machine-readable construct that can be passed to algorithms for processing.
Graphs are useful as a construct for information discovery when the user doesn’t necessarily know the starting point for the query. By starting at any node (a tip-off ), an analyst can traverse the graph to find related information. This workflow is called “know-something-find-something.” A number of heuristics for graph-based search assist in the navigation and exploration of large, multidimensional graphs that are difficult to visualize and navigate manually.
Deductive reasoning techniques integrate with graph analytics through manual and algorithmic filtering to quickly answer questions and convey knowledge from the graph to the human analyst. Analysts filter by relationship type, time, or complex queries about the intersection between edges and nodes to rapidly identify known information and highlight knowledge gaps.
15.4.1 Graphs and Linked Data
Chapter 10 introduced graph databases as a NoSQL construct for storing data that requires a flexible, adaptable schema. Graphs—and graph databases—are a useful construct for indexing intelligence data that is often held across multiple databases without requiring complex table joins and tightly coupled databases.
Using linked data, an analyst working issue “ C” can quickly discover the map and report directly connected to C, as well as the additional reports linked to related objects. C can also be packaged as a “super object” that contains an instance of all linked data with some number of degrees of separation—calculated by the number of graph edges—away from the starting object. The super object is essentially a stack of relationships to the universal resource identifiers (URIs) for each of the related object, documented using RDF triples or XML tags.
15.4.2 Provenance
Provenance is the chronology of the creation, ownership, custody, change, location, and status of a data object. The term was originally used in relation to works of art to “provide contextual and circumstantial evidence for its original production or discovery, by establishing, as far as practicable, its later history, especially the sequences of its formal ownership, custody, and places of storage” [22]. In law, the concept of provenance refers to the “chain of custody” or the paper trail of evidence. This concept logically extends to the documentation of the history of change of data in a knowledge system.
The W3C implemented a standard for provenance in 2013, documenting it as “information about entities, activities, and people involved in producing a piece of data or thing, which can be used to form assessments about its quality, reliability or trustworthiness” [23]. The PROV-O standard is web ontology language 2.0 (OWL2) ontology that maps the PROV logical data model to RDF [24]. The ontology describes hundreds of classes, properties, and attributes.
Maintaining provenance across a knowledge graph is critical to assembling evidence against hypotheses. Each analytic conclusion must be traced back to each piece of data that contributed to the conclusion. Although ABI methods can be enhanced with automated analytic tools, analysts at the end of the decision chain need to understand how data was correlated, combined, and manipulated through the analysis and synthesis process. Ongoing efforts across the community seek to document a common standard for data interchange and provenance tracking.
15.4.3 Using Graphs for Multianalyst Collaboration
In the legacy, linear TCPED model, when two agencies wrote conflicting reports about the same object, both reports promulgated to the desk of the all-source analyst. He or she adjudicated the discrepancies based on past experience with both sources. Unfortunately, the incorrect report often persisted—to be discovered in the future by someone else—unless it was recalled. Using the graph construct to organize around objects makes it easier to discover discrepancies that can be more quickly and reliably resolved. When analyzing data spatially, these discrepancies are instantly visible to the all-source analyst because the same object simultaneously appears in two places or states. Everything happens somewhere, and everything happens in exactly one place.
15.5 Information and Knowledge Sharing
Intelligence Community Directive Number 501, Discovery and Dissemination or Retrieval of Information Within the Intelligence Community, was signed by the DNI on January 21, 2009. Designed to “foster an enduring culture of responsible sharing within an integrated IC,” the document introduced the term “responsibility to provide” and created a complex relationship with the traditional mantra of “need to know”.
It directed that all authorized information be made available and discoverable “by automated means” and encouraged data tagging of mission-specific information. ICD 501 also defined “stewards” for collection and analytic production as:
An appropriately cleared employee of an IC element, who is a senior official, designated by the head of that IC element to represent the [collection/analytic] activity that the IC element is authorized by law or executive order to conduct, and to make determinations regarding the dissemination to or the retrieval by authorized IC personnel of [information collected/analysis produced] by that activity [25].
With a focus on improving discovery and dissemination of information, rather than protecting or hoarding information from authorized users, data stewards gradually replace data owners in this new construct. The data doesn’t belong to a person or agency. It belongs to the intelligence community. When applied, this change in perspective has a dramatic impact on the perspectives of information.
Prusak notes that knowledge “clumps” in groups and connectivity of individuals into groups and networks wins over knowledge capture.
Organizations that promote the development of social networks and the free exchange of information witness the establishment of self-organizing knowledge groups. Bahra says that there are three main conditions to assist in knowledge sharing [29, p. 56]:
• Reciprocity: One helps a colleague, thinking that he or she will receive valuable knowledge in return (even in the future).
• Reputation: Reputation, or respect for one’s work and expertise, is power, especially in the intelligence community.
• Altruism: Self-gratification and a passion or interest about a topic.
These three factors contribute to the simplest yet most powerful transformative sharing concepts in the intelligence community.
15.6 Wikis, Blogs, Chat, and Sharing
The historical compartmented nature of the intelligence community and its “need to know” policy is often cited as an impetus to information sharing.
Andrus’s essay – “The Wiki and the Blog: Toward a Complex Adaptive Intelligence Community,” which postulated that “the intelligence community must be able to dynamically reinvent itself by continuously learning and adapting as the national security environment changes”- won the intelligence community’s Galileo Award and was partially responsible for the start-up of a classified Wiki based on the platform and structure of Wikipedia called Intellipedia [31]. Shortly after its launch, the tool was used to write a high-level intelligence assessment on Nigeria. Thomas Fingar, the former deputy director of National Intelligence for Analysis (DDNI/A) cited Intellipedia’s success in rapidly characterizing Iraqi insurgents’ use of chlorine in improvised explosive devices highlighting the lack of bureaucracy inherent in the self-organized model.
While Intellipedia is the primary source for collaborative, semiformalized information sharing on standing and emergent intelligence topics, most analysts collaborate informally using a combination of chat rooms, Microsoft SharePoint sites, and person-to-person chat messages.
Because the ABI tradecraft reduces the focus on producing static intelligence products to fill a queue, ABI analysts tend to collaborate and share around in-work intelligence products. These include knowledge graphs on adversary patterns of life, shape file databases, and other in-work depictions that are often not suitable as finished intelligence products. In fact, the notion of “ABI products” is a source of continued consternation as standards bodies attempt to define what is new and different about ABI products, as well as how to depict the dynamics of human patterns of life on what is often a static Powerpoint chart.
Managers like reports and charts as a metric of analytic output because the total number of reports is easy to measure; however, management begins to question the utility of “snapping a chalk line” on an unfinished pattern-of-life analysis just to document a “product.” Increasingly, interactive products that use dynamic maps and charts are used for spatial storytelling. Despite all the resources allocated to glitzy multimedia products and animated movies, these products are rarely used because they are time-consuming, expensive, and usually late to need
15.8 Summary
Knowledge management is a crucial enabler for ABI because tacit and explicit knowledge about activities, patterns, and entities must be discovered and correlated across multiple disparate holdings to enable the principle of data neutrality. Increasingly, new technologies like graph data stores, recommendation engines, provenance tracing, wikis, and blogs, contribute to the advancement of ABI because they enhance knowledge discovery and understanding. Chapter 16 describes approaches that leverage these types of knowledge to formulate models to test alternative hypotheses and explore what might happen.
16
Anticipatory Intelligence
After reading chapters on persistent surveillance, big data processing, automated extraction of activities, analysis, and knowledge management, you might be thinking that if we could just automate the steps of the workflow, intelligence problems would solve themselves. Nothing could be further from the truth. In some circles, ABI has been conflated with predictive analytics and automated sensor cross-cueing, but the real power of the ABI method is in producing anticipatory intelligence. Anticipation is about considering alternative futures and what might happen…not what will happen. This chapter describes technologies and methods for capturing knowledge to facilitate exploratory modeling, “what-if ” trades, and evaluation of alternative hypotheses.
16.1 Introduction to Anticipatory Intelligence
Anticipatory intelligence is a systemic way of thinking about the future that focuses our long range foveal and peripheral vision on emerging conditions, trends, and threats to national security. Anticipation is not about prediction or clairvoyance. It is about considering a space of potential alternatives and informing decision-makers on their likelihood and consequence. Modeling and simulation approaches aggregate knowledge on topics, indicators, trends, drivers, and outcomes into a theoretically sound, analytically valid framework for exploring alternatives and driving decision advantage. This chapter provides a survey of the voluminous approaches for translating data and knowledge into models, as well as various approaches for executing those models in a data-driven environment to produce traceable, valid, supportable assessments based on analytic relationships, validated models, and real-world data.
16.1.1 Prediction, Forecasting, and Anticipation
In a quote usually attributed to physicist Neils Bohr or baseball player Yogi Berra, “Prediction is hard, especially about the future.” The terms “prediction,” “forecasting,” and “anticipation” are often used interchangeably but represent significantly different perspectives, especially when applied to the domain of intelligence analysis.
A prediction is a statement of what will or is likely to happen in the future. Usually, predictions are given as a statement of fact: “in the future, we will all have flying cars.” This statement lacks any estimate of likelihood, timing, confidence, or other factors that would justify the prediction.
Forecasts, though usually used synonymously with predictions, are often accompanied by quantification and justification. Meteorologists generate forecasts: “There is an 80% chance of rain in your area tomorrow.”
Forecasts of the distant future are usually inaccurate because underling models fail to account for disruptive and nonlinear effects.
While predictions are generated by pundits and crystal ball-waving fortune tellers, forecasts are generated analytically based on models, assumptions, observations, and other data.
Anticipation is the act of expecting or foreseeing something, usually with presentiment or foreknowledge. While predictions postulate the outcome with stated or implied certainty and forecasts provide a mathematical estimate of a given outcome, anticipation refers to the broad ability to consider alternative outcomes. Anticipatory analysis combines forecasts, institutional knowledge (see Chapter 15), and other modeling approaches to generate a series of “what if ” scenarios. The important distinction between prediction/forecasting and anticipation is that anticipation identifies what may happen. Anticipatory analysis sometimes allows analysis and quantification of possible causes. Sections 16.2–16.6 in this chapter will describe modeling approaches and their advantages and disadvantages for anticipatory intelligence analysts.
16.2 Modeling for Anticipatory Intelligence
Anticipatory intelligence is based on models. Models, sometimes called “analytic models,” provide a simplified explanation of how some aspect of the real world works to yield insight. Models may be tacit or explicit. Tacit models are based on knowledge and experience.
They exist in the analyst’s head and are executed routinely during decision processes whether the analyst is aware of it or not. Explicit models are documented using a modeling language, diagram, description, or other relationship.
16.2.1 Models and Modeling
The most basic approach is to construct a model based on relevant context and use the model to understand or visualize a result. Another approach, comparative modeling (2), uses multiple models with the same contextual input data to provide a common output. This approach is useful for exploring alternative hypotheses or examining multiple perspectives to anticipate what may happen and why. A third approach called model aggregation combines multiple models to allow for complex interactions. The third approach has been applied to human socio-cultural behavior (HSCB) modeling and human domain analytics on multiple programs over the past 20 years with mixed results (see Section 16.6). Human activities and behaviors and their ensuing complexity, nonlinearity, and unpredictability, represent the most significant modeling challenge facing the community today.
16.2.2 Descriptive Versus Anticipatory/Predictive Models
Descriptive models present the salient features of data, relationships, or processes. They may be as simple as a diagram on a white board or as complex as a wiring diagram for a distributed computer networks. Analysts often use descriptive models to identify the key attributes of a process (or a series of activities).
16.3 Machine Learning, Data Mining, and Statistical Models
Machine learning traces its origins to the 17th century where German mathematician Leibnitz began postulating formal mathematical relationships to represent human logic. In the 19th century, George Boole developed a series of relations for deductive processes (now called Boolean logic). By the mid 20th century, English mathematician Alan Turing and John McCarthy of MIT began experimenting with “intelligent machines,” and the term “artificial intelligence” was coined. Machine learning is a subfield of artificial intelligence concerned with the development of algorithms, models, and techniques that allow machines to “learn.”
Natural intelligence, often thought of as the ability to reason, is a representation of logic, rules, and models. Humans are adept pattern-matchers. Memory is a type of historical cognitive recall. Although the exact mechanisms for “learning” in the human brain are not completely understood, in many cases it is possible to develop algorithms that mimic human thought and reasoning processes. Many machine-learning techniques including rule-based learning, case-based learning, and unsupervised learning are based on our understanding of these cognitive processes.
16.3.1 Rule-Based Learning
In rule-based learning, a series of known logical rules are encoded directly as an algorithm. This technique is best suited for directly translating a descriptive model into executable code.
Rule-based learning is the most straightforward way to encode knowledge into an executable model, but it is also the most brittle for obvious reasons. The model can only represent the phenomena for which rules have been encoded. This approach significantly reinforces traditional inductive-based analytic approaches and is highly susceptible to surprise.
16.3.2 Case-Based Learning
Another popular approach is called case-based learning. This technique presents positive and negative situations for which a model is learned. The learning process is called “training”; the model and the data used are referred to as the “training set.”
This learning approach is useful when the cases—and their corresponding observables, signatures, and proxies —can be identified a priori.
In the case of counterterrorism, many terrorists participate in normal activities and look like any other normal individual in that culture. The distinguishing characteristics that describe “a terrorist” are few, making it very difficult to train automatic detection and classification algorithms. Furthermore, when adversaries practice denial and deception, a common technique is to mimic the distinguishing characteristics of the negative examples so as to hide in the noise. This approach is also brittle because the model can only interpret cases for which it has positive and negative examples.
16.3.3 Unsupervised Learning
Another popular and widely employed approach is that of unsupervised learning where a model is generated based upon a data set with little or no “tuning” from a human operator. This technique is also sometimes called data mining because the algorithm literally identifies “nuggets of gold” in an otherwise unseemly heap of slag.
This approach is based on the premise that the computational elements themselves are very simple, like the neurons in the human brain. Complex behaviors arise from connections between the neurons that are modeled as an entangled web of relationships that represent signals and patterns.
While many of the formal cognitive processes for human sensemaking are not easily documented, sensemaking is the process by which humans constantly weigh evidence, match patterns, postulate outcomes, and infer between missing information. Although the term analysis is widely used to refer to the job of intelligence analysts, many sensemaking tasks are a form of synthesis: the process of integrating information together to enhance understanding.
In 2014, demonstrating “cognitive cooking” technology, a specially trained version of WATSON created “Bengali Butternut BBQ Sauce,” a delicious combination of butternut squash, white wine, dates, Thai chilies, tamarind, and more
Artificial intelligence, data mining, and statistically created models are generally good for describing known phenomenon and forecasting outcomes (calculated responses) within a trained model space but are unsuitable for extrapolating outside the training set. Models must be used where appropriate, and while computational techniques for automated sensemaking have been proposed, many contemporary methods are limited to the processing, evaluation, and subsequent reaction to increasingly complex rule sets.
16.4 Rule Sets and Event-Driven Architectures
An emerging software design paradigm, event-driven architectures, are “a methodology for designing and implementing applications and systems in which events transmit between loosely coupled software components and services”.
Events are defined as a change in state, which could represent a change in the state of an object, a data element, or an entire system. An event-driven architecture applies to distributed, loosely coupled systems that require asynchronous processing (the data arrives at different times and is needed at different times). Three types of event processing are typically considered:
• Simple event processing (SEP): The system response to a change in condition and a downstream action is initiated (e.g., when new data arrives in the database, process it to extract coordinates).
• Event stream processing (ESP): A stream of events is filtered to recognize notable events that match a filter and initiate an action (e.g., when this type of signature is detected, alert the commander).
Complex event processing (CEP): Predefined rule sets recognize a combination of simple events, occurring in different ways and different times, and cause a downstream action to occur.
16.4.1 Event Processing Engines
According to developer KEYW, JEMA is widely accepted across the intelligence community as “a visual analytic model authoring technology, which provides drag-and-drop authoring of multi-INT, multi-discipline analytics in an online collaborative space” [11]. Because JEMA automates data gathering, filtering, and processing, analysts shift the focus of their time from search to analysis.
Many companies use simple rule processing for anomaly detection, notably credit card companies whose fraud detections combine simple event processing and event stream detection. Alerts are triggered on anomalous behaviors.
16.4.2 Simple Event Processing: Geofencing, Watchboxes, and Tripwires
Another type of “simple” event processing highly relevant to spatiotemporal analysis is a technique known as geofencing.
A dynamic area of interest is a watchbox that moves with an object. In the Ebola tracking example, the dynamic areas of interest are centered on each tagged ship with a user-defined radius. This allows the user to identify when two ships come within close proximity or when the ship passes near a geographic feature like a shoreline or port, providing warning of potential docking activities.
To facilitate the monitoring of thousands of objects, rules can be visualized on a watchboard that uses colors, shapes, and other indicators to highlight rule activation and other triggers. A unique feature of LUX is the timeline view, which provides an interactive visualization of patterns across individual rules or sets of rules as shown in Figure 16.6 and how rules and triggers change over time.
16.4.4 Tipping and Cueing
The original USD(I) definition for ABI referred to “analysis and subsequent collection” and many models for ABI describe the need for “nonlinear TCPED” where the intelligence cycle is dynamic to respond to changing intelligence needs. This desire has often been restated as the need for automated collection in response to detected activities, or “automated tipping and cueing.”
Although the terms are usually used synonymously, a tip is the generation of an actionable report or notification of an event of interest. When tips are sent to human operators/analysts, they are usually called alerts. A cue is a more related and specific message sent to a collection system as the result of a tip. Automated tipping and cueing systems rely on tip/cue rules that map generated tips to the subsequent collection that requires cueing.
Numerous community leaders have highlighted the importance of tipping and cueing to reduce operational timelines and optimize multi-INT collection.
Although many intelligence community programs conflate “ABI” with tipping and cueing, the latter is an inductive process that is more appropriately paired with monitoring and warning for known signatures after the ABI methods have been used to identify new behaviors from an otherwise innocuous set of data. In the case of modeling, remember that models only respond to the rules for which they are programmed; therefore tipping and cueing solutions may improve efficiency but may inhibit discovery by reinforcing the need to monitor known places for known signatures instead of seeking the unknown unknowns.
16.5 Exploratory Models
Data mining and statistical learning approaches create models of behaviors and phenomenon, but how are these models executed to gain insight. Exploratory modeling is a modeling technique used to gain a broad understanding of a problem domain, key drivers, and uncertainties before going into details
16.5.1 Basic Exploratory Modeling Techniques
There are many techniques for exploratory modeling. Some of the most popular include Bayes nets, Markov chains, Petri nets, and discrete event simulation.
Discrete event simulation (DES) is another state transition and process modeling technique that models a system as a series of discrete events in time. In contrast to continuously executing simulations (see agent-based modeling and system dynamics in Sections 16.5.3 and 16.5.4), the system state is determined by activities that happen over user-defined time slices. Because events can cross multiple time slices, every time slice does not have to be simulated.
16.5.2 Advanced Exploratory Modeling Techniques
There is also a class of modeling techniques for studying emergent behaviors and modeling of complex systems with a focus on discovery emerged due to shortfalls in other modeling techniques.
16.5.3 ABM
ABM is an approach that develops complex behaviors by aggregating the actions and interactions of relatively simple “agents.” According to ABM pioneer Andrew Ilachinski, “agent-based simulations of complex adaptive systems are predicated on the idea that the global behavior of a complex system derives entirely from the low-level interactions among its constituent agents” [23]. Human operators define the goals of agents. In simulation, agents make decisions to optimize their goals based on perceptions of the environment. The dynamics of multiple, interacting agents often lead to interesting and complicated emergent behaviors.
16.5.4 System Dynamics Model
System dynamics is another popular approach to complex systems modeling that defines relationships between variables in terms of stocks and flows. Developed by MIT professor Jay Forrester in the 1950s, system dynamics was concerned with studying complexities in industrial and business processes.
By the early 2000s, system dynamics emerged as a popular technique to model the human domain and its related complexities. Between 2007 and 2009, researchers from MIT and other firms worked with IARPA on the Pro-Active Intelligence (PAINT) program “to develop computational social science models to study and understand the dynamics of complex intelligence targets for nefarious activity” [26]. Researchers used system dynamics to examine possible drivers of nefarious technology development (e.g., weapons of mass destruction) and critical pathways and flows including natural resources, precursor processes, and intellectual talent.
Another aspect of the PAINT program was the design of probes. Since many of the indicators of complex processes are not directly observable, PAINT examined input activities like sanctions that may prompt the adversary to do something that is observable. This application of the system dynamics modeling technique is appropriate for anticipatory analytics because it allows analysts to test multiple hypotheses rapidly in a surrogate environment. In one of the examples cited by MIT researchers, analysts examined a probe targeted at human resources where the simulators examined potential impacts of hiring away key personnel resources with specialized skills. This type of interactive, anticipatory analysis lets teams of analysts examine potential impacts of different courses of action.
System dynamics models have the additional property that the descriptive model of the system also serves as the executable model when time constants and influence factors are added to the representation. The technique suffers from several shortcomings including the difficulty in establishing transition coefficients, the impossibility of model validation, and the inability to reliably account for known and unknown external influences on each factor.
16.6 Model Aggregation
Analysts can improve the fidelity of anticipatory modeling by combining the results from multiple models. One framework for composing multiple models is the multiple information model synthesis architecture (MIMOSA), developed by Information Innovators. MIMOSA “aided one intelligence center to increase their target detection rate by 500% using just 30% of the resources previously tasked with detection freeing up personnel to focus more on analysis” [29]. MIMOSA uses target sets (positive examples of target geospatial regions) to calibrate models for geospatial search criteria like proximity to geographic features, foundation GEOINT, and other spatial relationships. Merging multiple models, the software aggregates the salient features of each model to reduce false alarm rate and improve the predictive power of the combined model.
An approach for multiresolution modeling of sociocultural dynamics was developed by DARPA for the COMPOEX program in 2007. COMPOEX provided multiple types of agent-based, system dynamics, and other models in a variable resolution framework that allowed military planners to swap different models to test multiple courses of action across a range of problems. A summary of the complex modeling environment is shown in Figure 16.10. COMPOEX includes modeling paradigms such as concept maps, social networks, influence diagrams, differential equations, causal models, Bayes networks, Petri nets, dynamic system models, event-based simulation, and agent-based models [31]. Another feature of COMPOEX was a graphical scenario planning tool that allowed analysts to postulate possible courses of action, as shown in Figure 16.11.
Each of the courses of action in Figure 16.11 was linked to one or more of the models across the sociocultural behavior analysis hierarchy, abstracting the complexity of models and their interactions away from analysts, planners, and decision makers. The tool forced models at various resolutions to interact (Figure 16.10) to stimulate emergent dynamics so planners could explore plausible alternatives and resultant courses of action.
Objects can usually be modeled using physics-based or process models. However, an important tenet of ABI is that these objects are operated by someone (who). Knowing something about the “who” provides important insights into the anticipated behavior of those objects.
16.7 The Wisdom of Crowds
Most of the anticipatory analytic techniques in this chapter refer to analytic, algorithmic, or simulation-based models that exist as computational processes; however, it is important to mention a final and increasingly popular type of modeling approach based on human input and subjective judgment.
James Surowiecki, author of The Wisdom of Crowds, popularized the concept of information aggregation that surprisingly leads to better decisions than those made by any single member of the group. It offers anecdotes to illustrate the argument, which essentially acts as a counterpoint to the maligned concept of “groupthink.” Surowiecki differentiates crowd wisdom from group think by identifying four criteria for a “wise crowd” [33]:
• Diversity of opinion: Each person should have private information even if it’s just an eccentric interpretation of known facts.
• Independence: People’s opinions aren’t determined by the opinions of those around them.
• Decentralization: People are able to specialize and draw on local knowledge
• Aggregation: Some mechanism exists for turning private judgments into a collective decision
A related DARPA program called FutureMAP was canceled in 2003 amidst congressional criticism regarding “terrorism betting parlors”; however, the innovative idea was reviewed in depth by Yeh in Studies in Intelligence in 2006 [36]. Yeh found that prediction markets could be used to quantify uncertainty and eliminate ambiguity around certain types of judgments. George Mason University launched IARPA-funded SciCast, which forecasts scientific and technical advancements.
16.8 Shortcomings of Model-Based Anticipatory Analytics
By now, you may be experiencing frustration that none of the modeling techniques in this chapter are the silver bullet for all anticipatory analytic problems. The challenges and shortcomings for anticipatory modeling are voluminous.
The major shortcoming of all models is that they can’t do what they aren’t told. Rule-based models are limited to user-defined rules, and statistically generated models are limited to the provided data. As we have noted on multiple occasions, intelligence data is undersampled, incomplete, intermittent, error-prone, cluttered, and deceptive. All of these are ill-suited for turnkey modeling.
A combination of many types of modeling approaches is needed to perform accurate, justifiable, broad based anticipatory analysis. Each of these needs validation, but model validation, especially in the field of intelligence, is a major challenge. We seldom have “truth” data. The intelligence problem and its underlying assumptions are constantly evolving as are attempts to solve it, a primary criterion for what Rittel and Weber call “wicked problems” [39].
Handcrafting models is slow, and a high level of skill is required to use many modeling tools. Furthermore, most of these tools do not allow easy sharing across other tools or across modeling approaches, complicating the ability to share and compare models. This challenge is exacerbated by the distributed nature of knowledge in the intelligence community.
When models exist, analysts depend heavily on “the model.” Sometimes it has been right in the past. Perhaps it was created by a legendary peer. Maybe there’s no suitable alternative. Overdependence on models and extrapolation of models into regions where they have not been validated leads to improper conclusions.
A final note: weather forecasting relies on physics-based models with thousands of real-time data feeds, decades of forensic data, ground truth, validated physics-based models, one-of-a-kind supercomputers, and a highly trained cadre of scientists, networked to share information and collaborate. It is perhaps the most modeled problem in the world. Yet weather “predictions” are often wrong, or at minimum imprecise. What hope is there for predicting human behaviors based on a few spurious observations?
16.9 Modeling in ABI
In the early days of ABI, analysts in Iraq and Afghanistan lacked the tools to formally model activities. As analysts assembled data in an area, they developed a tacit mental model of what was normal. Their geodatabases representing a pattern of life constituted a type of model of what was known. The gaps in those databases represented the unknown. Their internal rules for how to correlate data, separating the possibly relevant from the certainly irrelevant composed part of a workflow model as did their specific method for data conditioning and georeferencing.
However, relying entirely on human analysts to understand increasingly complex problem sets also presents challenges. Studies have shown that experts (including intelligence analysts) are subject to biases due to a number of factors like perception, evaluation, omission, availability, anchoring, groupthink, and others.
Analytic models that treat facts and relationships explicitly provide a counterbalance to inherent biases in decision-making. Models can also quickly process large amounts of data and multiple scenarios without getting tired, bored, or discounting information.
Current efforts to scale ABI across the community focus heavily on activity, process, and object modeling as this standardization is believed to enhance information sharing and collaboration. Algorithmic approaches like JEMA, MIMOSA, PAINT, and LUX have been introduced to worldwide users.
16.10 Summary
Models provide a mechanism for integrating information and exploring alternatives, improving an analyst’s ability to discover the unknown. However, if models can’t be validated, executed on sparse data, or trusted to solve intelligence problems, can any of them be trusted? If “all models are wrong,” in the high-stakes business of intelligence analysis, are any of them useful?
Model creation requires a multidisciplinary, multifaceted, multi-intelligence approach to data management, analysis, visualization, statistics, correlation, and knowledge management. The best model builders and analysts discover that it’s not the model itself that enables anticipation. The exercise in data gathering, hypothesis testing, relationship construction, code generation, assumption definition, and exploration trained the analyst. To build a good model, the analyst had to consider multiple ways something might happen—to consider the probability and consequence of different outcomes. The data landscape, adversary courses of action, complex relationships, and possible causes are all discovered in the act of developing a valid model. Surprisingly, when many analysts set out to create a model they end by realizing they became one.
17
ABI in Policing
Patrick Biltgen and Sarah Hank
Law enforcement and policing shares many common techniques with intelligence analysis. Since 9/11, police departments have implemented a number of tools and methods from the discipline of intelligence to enhance the depth and breadth of analysis.
17.1 The Future of Policing
Although precise prediction of future events is impossible, there is a growing movement among police departments worldwide to leverage the power of spatiotemporal analytics and persistent surveillance to resolve entities committing crimes, understand patterns and trends, adapt to changing criminal tactics, and better allocate resources to the areas of greatest need. This chapter describes the integration of intelligence and policing— popularly termed “intelligence-led policing”—and its evolution over the past 35 years.
17.2 Intelligence-Led Policing: An Introduction
The term “intelligence-led policing” traces its origins to the 1980s at the Kent Constabulatory in Great Britain. Faced with a sharp increase in property crimes and vehicle thefts, the department struggled with how to allocate officers amidst declining budgets [2, p. 144]. The department developed a two-pronged approach to address this constraint. First, it freed up resources so detectives had more time for analysis by prioritizing service calls to the most serious offenses and referring lower priority calls to other agencies. Second, through data analysis it discovered that “small numbers of chronic offenders were responsible for many incidents and that patterns also include repeat victims and target locations”.
The focus of analysis and problem solving is to analyze and understand the influencers of crime using techniques like statistical analysis, crime mapping, and network analysis. Police presence is optimized to deter and control these influencers while simultaneously collecting additional information to enhance analysis and problem solving. A technique for optimizing police presence is described in Section 17.5.
Intelligence-led policing applies analysis and problem solving techniques to optimize resource allocation in the form of focused presence and patrols. Accurate dissemination of intelligence, continuous improvement, and focused synchronized deployment against crime are other key elements of the method.
17.2.1 Statistical Analysis and CompStat
The concept of ILP was implemented in the New York City police department in the 1980s by police commissioner William Bratton and Jack Maple. Using a computational statistics approach called CompStat, “crime statistics are collected, computerized, mapped and disseminated quickly” [5]. Wall-sized “charts of the future” mapped every element of the New York transit system. Crimes were mapped against the spatial nodes and trends were examined.
Though its methods are controversial, CompStat is widely credited with a significant reduction in crime in New York. The method has since been implemented at other major cities in the United States with a similar result, and the methods and techniques for statistical analysis of crimes is standard in criminology curricula.
17.2.2 Routine Activities Theory
A central tenet of ILP is based on Cohen and Felson’s routine activities theory, which is the general principle that human activities tend to follow predictable patterns in time and space. In the case of crime, the location for these events is defined by the influencers of crime(Figure 17.2). Koper provides exposition of these influencers: “crime does not occur randomly but rather is produced by the convergence in time and space of motivated offenders, suitable targets, and the absence of capable guardians.”
17.3 Crime Mapping
Crime mapping is a geospatial analysis technique that geolocates and categorizes crimes to detect hot spots, understand the underlying trends and patterns, and develop courses of action. Crime hot spots are a type of spatial anomaly that may be characterized at the address, block, block cluster, ward, county, geographic region, or state level—the precision of geolocation and the aggregation depends on the area of interest and the question being asked.
17.3.1 Standardized Reporting Enables Crime Mapping
In 1930, Congress enacted Title 28, Section 534 of the U.S. code, authorizing the Attorney General and subsequently the FBI to standardize and gather crime information [6]. The FBI implemented the Uniform Crime Reporting Handbook, standardizing and normalizing the methods, procedures, and data formats for documenting criminal activity. This type of data conditioning enables information sharing and pattern analysis by ensuring consistent reporting standards across jurisdictions.
17.3.2 Spatial and Temporal Analysis of Patterns
Visualizing each observation as a dot at the city or regional level is rarely informative. For example, in the map in Figure 17.3, discerning a meaningful trend requires extensive data filtering by time of day, type of crime, and other criteria. One technique that is useful to understand trends and patterns is the aggregation of individual crimes into spatial regions.
Mapping aggregated crime data by census tract reveals that the rate of violent crime does not necessarily relate to quadrants, but rather to natural geographic barriers such as parks and rivers. Other geographic markers like landmarks, streets, and historical places may also act as historical anchors for citizens’ perspectives on crime.
Another advantage of aggregating data by area using a GIS is the ability to visualize change over time.
17.4 Unraveling the Network
Understanding hot spots and localizing the places where crimes tend to occur is only part of the story, and reducing crimes around hot spots is only a treatment of the symptoms rather than the cause of the problem. Crime mapping and intelligence-led policing focus on the ABI principles of collecting, characterizing, and locating activities and transactions. Unfortunately, these techniques alone are insufficient to provide entity resolution, identify and locate the actors and entities conducting activities and transactions, and identify and locate networks of actors. These techniques are generally a reactive, sustaining approach to managing crime. The next level of analysis gets to the root cause of crime to go after the heart of the network to resolve entities, understand their relationships, and proactively attack the seams of the network.
The Los Angeles Police Department’s Real-Time Analysis and Critical Response (RACR) division is a state-of-the-art, network enabled analysis cell that uses big data to solve crimes. Police vehicles equipped with roof-mounted license plate readers provide roving wide-area persistent surveillance by vacuuming up geotagged vehicle location data as they patrol the streets.
One of the tools used by analysts in the RACR is made by Palo Alto-based Palantir Technologies. Named after the all-seeing stones in J. R. R. Tolkien’s Lord of the Rings, Palantir is a data fusion platform that provides a clean, coherent abstraction on top of different types of data that all describe the same real world problem”. Palantir enables “data integration, search and discovery, knowledge management, secure collaboration, and algorithmic analysis across a wide variety of data sources”. Using advanced artificial intelligence algorithms—coupled with an easy-to-use graphical interface—Palantir helps trained investigators identify connections between disparate databases to rapidly discover links between people.
Before Palantir was implemented, analysts missed these connections because field interview (FI) data, department of motor vehicles data, and automated license plate reader data was all held in separate databases. The department also lacked situational awareness about where their patrol cars were and how they were responding to requests for help. Palantir integrated analytic capabilities like “geospatial search, trend analysis, link charts, timelines, and histograms” to help officers find, visualize, and share data in near-real time.
17.5 Predictive Policing
Techniques like crime mapping, intelligence-led policing, and network analysis, when used together, enable all five principles of ABI and move toward the Minority Report nirvana described at the beginning of the chapter. This approach has been popularized as “predictive policing.”
Although some critics have questioned the validity of PredPol’s predictions, “during a four-month trial in Kent [UK], 8.5% of all street crime occurred within PredPol’s pink boxes…predictions from police analysts scored only 5%”
18
ABI and the D.C. Beltway Sniper
18.5 Data Neutrality
Any piece of evidence may solve a crime. This is a well-known maxim within criminal cases and is another way of stating the ABI pillar of data neutrality. Investigators rarely judge that one piece of evidence is more important to a case than another with equal pedigree. Evidence is evidence. Coupled with the concept of data neutrality, crime scene processing is essentially a processes of incidental collection. When a crime scene is processed, investigators might know what they are looking for (a spent casing from a rifle) but may discover objects they were not looking for (an extortion note from a killer). Crime scene specialists enter a crime scene with an open mind and collect everything available. They generally make no value judgment on the findings during collection nor do they discard any evidence, for who knows what piece of detritus might be fundamental to building a case.
The lesson learned here, which is identical to the lesson learned within the ABI community, is to collect and keep everything; one never knows if and when it will be important.
18.6 Summary
The horrific events that comprise the D.C. snipers serial killing spree makes an illustrative case study for the application of the ABI pillars. By examining the sequence of events and the analysis that was performed, the following conclusions can be drawn. First, georeferencing all data would have improved understanding of the data and provided context. Unfortunately, the means to do that did not exist at the time. Second, integrating before exploitation might have prevented law enforcement from erroneously tracking and stopping white cargo vans. Again the tools to do this integration do not appear to have existed in 2002.
Interestingly, sequence neutrality and data neutrality were applied to great effect. Once a caller tied two separate crimes together, law enforcement was able to use all the information collected in the past to solve the current crime.
19
Analyzing Transactions in a Network
William Raetz
One of the key differences in the shift from target-based intelligence to ABI is that targets of interest become the output of deductive, geospatial, and relational analysis of activities and transactions. As RAND’s Gregory Treverton noted in 2011, imagery analysts “used to look for things and know what we were looking for. If we saw a Soviet T-72 tank, we knew we’d find a number of its brethren nearby. Now…we’re looking for activities or transactions. And we don’t know what we’re looking for” [1, p. ix]. This chapter demonstrates deductive and relational analysis using simulated activities and transactions, providing a real-world application for entity resolution and the discovery of unknowns.
19.1 Analyzing Transactions with Graph Analytics
Graph analytics—derived from the discrete mathematical discipline of graph theory—is a technique for examining the relationship between data using pairwise relationships. Numerous algorithms and visualization tools for graph analytics have proliferated over the past 15 years. This example demonstrates how simple geospatial and relational analysis tools can be used to understand complex patterns of movement—the activities and transactions conducted by entities—over a city-sized area. This scenario involves an ABI analyst looking for a small “red network” of terrorists hiding among a civilian population.
Hidden within the normal patterns of the 4,623 entities is a malicious network. The purpose of this exercise is to analyze the data using ABI principles to unravel this network: to discover the signal hidden in the noise of everyday life.
The concepts of “signal” and “noise,” which have their origin in signal processing and electrical engineering, are central to the analysis of nefarious actors that operate in the open but blend into the background. Signal is the information relevant to an analyst contained in the data; noise is everything else. For instance, a “red,” or target, network’s signal might consist of activity unique to achieving their aims; unusual purchases, a break in routine, or gatherings at unusual times of day are all possible examples of signal.
Criminal and terrorist networks have become adept at masking their signal—the “abnormal” activity necessary to achieve their aims—in the noise of the general population’s activity. To increase the signal-to-noise ratio (SNR), an analyst must determine inductively or deductively what types of activities constitute the signal. In a dynamic, noisy, densely populated environment, this is difficult unless the analyst can narrow the search space by choosing a relevant area of interest, choosing a time period when enemy activity is likely to be greater, or beginning with known watch listed entities as the seeds for geochaining or geospatial network analysis.
19.2 Discerning the Anomalous
Separating out the signal from the background noise is as much art as science. As an analyst becomes more familiar with a population or area, “normal,” or background, behavior becomes inherent through tacit model building and hypothesis testing.
The goals and structure of the target group define abnormal activity. For example, the activity required to build and deploy an improvised explosive device (IED) present in the example data set will be very different from money laundering. A network whose aim is to build and deploy an IED may consist of bomb makers, procurers, security, and leadership within a small geographic area. Knowing the general goals and structure of the target group will help identify the types of activities that constitute signal.
Nondiscrete locations where many people meet will have a more significant activity signature. The analyst will also have to consider how entities move between these locations and discrete locations that have a weaker signal but contribute to a greater probability of resolving a unique entity of interest. An abnormal pattern of activity around these discrete locations is the initial signal the analyst is looking for.
At this point, the analyst has a hypothesis, a general plan based on his knowledge of the key types of locations a terrorist network requires. He will search for locations that look like safe house and warehouse locations based on events and transactions. When the field has been narrowed to a reasonable set of possible discrete locations, he will initiate forensic backtracking of transactions to identify additional locations and compile a rough list of red network members from the participating entities. This is an implementation of the “where-who” concept from Chapter 5.
19.3 Becoming Familiar with the Data Set
After receiving the data and the intelligence goal, the analyst’s first step is to familiarize himself with the data. This will help inform what processing and analytic tasks are possible; a sparse data set might require more sophistication, while a very large one may require additional processing power. In this case, because the available data is synthetic, the data is presented in three clean comma-separated value (.csv) files (Table 19.1). Analysts typically receive multiple files that may come from different sources or may be collected/created at different times.
It is important to note that the activity patterns for a location represent a pattern-of-life element for the entities in that location and for participating entities. The pattern-of-life element provides some hint to the norms in the city. It may allow the analyst to classify a building based on the times and types of activities and transactions (Section 19.4.1) and to identify locations that deviate from these cultural norms. Deducing why locations deviate from the norm—and whether these deviations are significant—is part of the analytic art of separating signal from background noise.
19.4.1 Method: Location Classification
One of the most technically complex methods of finding suspicious locations is to interpret these activity patterns through a series of rules to determine which are “typical” of a certain location type. For instance, if a location exhibits a very typical workplace pattern, as evidenced by its distinctive double peak, it can be eliminated from consideration, based on the assumption that the terrorist network prefers to avoid conducting activities at the busiest times and locations.
Because there is a distinctive and statistically significant difference between discrete and nondiscrete locations using the average time distance technique, the analyst can use the average time between activities to identify probable home locations. He calculates the average time between activities for every available uncategorized location and treats all the locations with an average greater than three as single-family home locations.
19.4.2 Method: Average Time Distance
The method outlined in Section 19.4.1 is an accurate but cautious way of using activity patterns to classify location types. In order to get a different perspective on these locations, instead of looking at the peaks of activity patterns, the analyst will next look at the average time between activities.
19.4.3 Method: Activity Volume
The first steps of the analysis process filtered out busy workplaces (nondiscrete locations) and single-family homes (discrete locations), leaving the analyst with a subset of locations that represent unconventional workplaces and other locations that may function as safe houses or warehouses.
The analyst uses an activity volume filter to remove all of the remaining locations that have many more activities than expected. He also removes all locations with no activities, assuming the red network used a location shortly before its attack.
19.4.4 Activity Tracing
The analyst’s next step is to choose a few of the best candidates for additional collection. If 109 is too many locations to examine in the time required by the customer, he can create a rough prioritization by making a final assumption about the behavior of the red network by assuming they have traveled directly between at least two of their locations.
19.5 Analyzing High-Priority Locations with a Graph
To get a better understanding of how these locations are related, and who may be involved, the analyst creates a network graph of locations, using tracks to infer relationships between locations. The network graph for these locations is presented in Figure 19.7.
19.6 Validation
At this point, the analyst has taken a blank slate and turned a hypothesis into a short list of names and locations.
19.7 Summary
This example demonstrates deductive methods for activity and transaction analysis that reduce the number of possible locations to a much smaller subset using scripting, hypotheses, analyst-derived rules, and graph analysis. To get started, the analyst had to wrestle with the data set to become acquainted with the data and the patterns of life for the area of interest. He formed a series of assumptions about the behavior of the population and tested these by analyzing graphs of activity sliced different ways. Then the analyst implemented a series of filters to reduce the pool of possible locations. Focusing on locations and then resolving entities that participated in activities and transactions—georeferencing to discover—was the only way to triage a very large data set with millions of track points. Because locations have a larger activity signature than individuals in the data set, it is easier to develop and test hypotheses on the activities and transactions around a location and then use this information as a tip for entity-focused graph analytics.
Through a combination of these filters the analyst removed 5,403 out of 5,445 locations. This allowed for highly targeted analysis (and in the real world, subsequent collection). In the finale of the example, two interesting entities were identified based on their relationship to the suspicious locations. In addition to surveilling these locations, these entities and their proxies could be targeted for collection and analysis.
21
Visual Analytics for Pattern-of-Life Analysis
This chapter integrates concepts for visual analytics with the basic principles of georeference to discover to analyze the pattern-of-life of entities based on check-in records from a social network.
It presents several examples of complex visualizations used to graphically understand entity motion and relationships across named locations in Washington, D.C., and the surrounding metro area. The purpose of the exercise is to discover entities with similar patterns of life and cotraveling motion patterns—possibly related entities. The chapter also examines scripting to identify intersecting entities using the R statistical language.
21.1 Applying Visual Analytics to Pattern-of-Life Analysis
Visual analytic techniques provide a mechanism for correlating data and discovering patterns.
21.1.3 Identification of Cotravelers/Pairs in Social Network Data
Visual analytics can be used to identify cotravelers, albeit with great difficulty.
Further drill down (Figure 21.5) reveals 11 simultaneous check-ins, including one three-party simultaneous check-in at a single popular location.
The next logical question—an application of the where-who-where concept discussed in Chapter 5—is “do these three individuals regularly interact?”
21.2 Discovering Paired Entities in a Large Data Set
Visual analytics is a powerful, but often laborious and serendipitous approach to exploring data sets. An alternative approach is to write code that seeks mathematical relations in the data. Often, the best approach is to combine the techniques.
It is very difficult to analyze data with statistical programming languages if the analysts/data scientists do not know what they are looking for. Visual analytic exploration of the data is a good first step to establish hypotheses, rules, and relations that can then be coded and processed in bulk for the full dataset.
Integrating open-source data, the geolocations can be correlated with named locations like the National Zoo and the Verizon Center. Open-source data also tells us that the event at the Verizon Center was a basketball game between the Utah Jazz and Washington Wizards. The pair cotravel only for a single day over the entire data set. We might conclude that this entity is an out-of-town guest. That hypothesis can be tested by returning to the 6.4-million-point worldwide dataset.
User 129395 checked in 122 times and only in Stafford and Alexandria, Virginia, and the District of Columbia. During the day, his or her check-ins are in Alexandria, near Duke St. and Telegraph Rd. (work). In the evenings, he or she can be found in Stafford (home). This is an example of identifying geospatial locations based on the time of day and the pattern-of-life elements present in this self-reported data set.
Note that another user, 190, also checks in at the National Zoo at the same time as the cotraveling pair. We do not know if this entity was cotraveling the entire time and decided to check in at only a single location or if this is an unrelated entity that happened to check in near the cotraveling pair while all three of them were standing next to the lions and tigers exhibit. The full data set finds user 190 all over the world, but his or her pattern of life places him or her most frequently in Denver, Colorado.
And what about the other frequent cotraveler, 37398? The pair coincidentally checked in 10 times over a four-month period, between the hours of 14:00 and 18:00 and 21:00 and 23:59 at the Natural History Museum, Metro Center, the National Gallery of Art, and various shopping centers and restaurants around Stafford, Virginia. We might conclude that this is a family member, child, friend, or significant other.
21.3 Summary
This example demonstrates how a combination of spatial analysis, visual analytics, statistical filtering, and scripting can be combined to understand patterns of life in real “big data” sets; however, conditioning, ingesting, and filtering this data to create a single example took more than 12 hours.
Because this data requires voluntary check-ins at registered locations, it is an example of the sparse data typical of intelligence problems. If the data consisted of beaconed location data from GPS-enabled smartphones, it would be possible to identify multiple overlapping locations.
22
Multi-INT Spatiotemporal Analysis
A 2010 study by OUSD(I) identified “an information domain to combine persistent surveillance data with other INTs with a ubiquitous layer of GEOINT” as one of 16 technology gaps for ABI and human domain analytics [1]. This chapter describes a generic multi-INT spatial, temporal, and relational analysis framework widely adopted by commercial tool vendors to provide interactive, dynamic data integration and analysis to support ABI techniques.
22.1 Overview
ABI analysis tools are increasingly instantiated using web-based, thin client interfaces. Open-source web mapping and advanced analytic code libraries have proliferated.
22.2 Human Interface Basics
A key feature for spatiotemporal-relational analysis tools is the interlinking of multiple views, allowing analysts to quickly understand how data elements are located in time and space, and in relation to other data.
22.2.1 Map View
An “information domain for combining persistent surveillance data on a ubiquitous foundation of GEOINT” drives the central feature of the analysis environment to the map. Spatial searches are performed using a bounding box (1). Events are represented as geolocated dots or symbols (2). Short text descriptions annotate events. Tracks—a type of transaction—are represented as lines with a green dot for starts and a red dot or X for stops (3). Depending on the nature of the key intelligence question (KIQ) or request for information (RFI), the analyst can choose to discover and display full tracks or only starts and stops. Clicking on any event or track point in the map brings up metadata describing the data element. Information like speed and heading accompany track points. Other metadata related to the collecting sensor may be appended to other events and transactions collected from unique sensors. Uncertainty around event position may be represented by a 95% confidence ellipse at the time of collection (4).
22.2.2 Timeline View
Temporal analysis requires a timeline that depicts spatial events and transactions as they occur in time. Many geospatial tools—originally designed to make a static map that integrates layered data at a point in time—have added timelines to allow animation of data or the layering of temporal data upon foundational GEOINT. Most tools instantiate the timeline below the spatial view (Google Earth uses timeline slider in the upper left corner of the window).
22.2.3 Relational View
Relational views are popular in counterfraud and social network analysis tools like Detica NetReveal and Palantir. By integrating a relational view or a graph with the spatiotemporal analysis environment, it is possible to link different spatial locations, events, and transactions by relational properties.
The grouping of multisource events and transactions is an activity set (Figure 22.2). The activity set acts as a “shoebox” for sequence neutral analysis. In the course of examining data in time and space, an analyst identifies data that appears to be related, but does not know the nature of the relationship. Drawing a box around the data elements, he or she can group them and create an activity set to save them for later analysis, sharing, or linking with other activity sets.
By linking activity sets, the analyst can describe a filtered set of spatial and temporal events as a series of related activities. Typically, linked activity sets form the canvas for information sharing across multiple analysts working the same problem set. The relational view leverages graphs and may also instantiate semantic technologies like the RDF to provide context to relationships.
22.3 Analytic Concepts of Operations
This section describes some of the basic analysis principles widely used in spatiotemporal analysis tools.
22.3.1 Discovery and Filtering
In the traditional, target-based intelligence cycle, analysts would enter a target identifier to pull back all information about the target, exploit that information, report on the target, and then go on to the next target. In ABI analysis, the targets are unknown at the onset of analysis and must be discovered through deductive analytics, reasoning, pattern analysis, and information correlation.
Searching for data may result in querying many distributed databases. Results are presented to the user as map/timeline renderings. Analysts typically select a smaller time slice and animate through the data to exploit transactions or attempt to recognize patterns. This process is called data triage. Instead of requesting information through a precisely phrased query, ABI analytics prefers to bring all available data to analysts’ desktop so they can determine if the information has value. This process implements the ABI principles of data neutrality and integration before exploitation simultaneously. It also places a large burden on query and visualization systems—most of the data returned by the query will be discarded as irrelevant. However, filtering out data a priori risks losing valuable correlatable information in the area of interest.s
22.3.2 Forensic Backtracking
Analysts use the framework for forensic backtracking, an embodiment of the sequence neutral paradigm of ABI. PV Labs describes a system that “indexes data in real time, permitting the data to be used in various exploitation solutions… for backtracking and identifying nodes of other multi-INT sources”.
Exelis also offers a solution for “activity-based intelligence with forensic capabilities establishing trends and interconnected patterns of life including social interactions, origins of travel and destinations” [4].
Key events act as tips to analysts or the start point for forward or forensic analysis of related data.
22.3.3 Watchboxes and Alerts
A geofence is a virtual perimeter used to trigger actions based on geospatial events [6]. Metzger describes how this concept was used by GMTI analysts to provide real-time indication and warning of vehicle motion.
Top analysts continually practice discovery and deductive filtering to update watchboxes with new hypotheses, triggers, and thresholds.
Alerts may result in subsequent analysis or collection. For example, alerts may be sent to collection management authorities with instructions to collect on the area of interest with particular capabilities when events and transactions matching certain filters are detected. When alerts go to collection systems, they are typically referred to as “tips” or “cues.”
22.3.4 Track Linking
As described in Chapter 12, automated track extraction algorithms seldom produce complete tracks from an object’s origin to its destination. Various confounding factors like shadows and obstructions cause track breaks. A common feature in analytic environments is the ability to manually link tracklets based on metadata.
22.4 Advanced Analytics
Another key feature of many ABI analysis tools is the implementation of “advanced analytics”—automated algorithmic processes that automate routine functions or synthesize large data sets into enriched visualizations.
Density maps allow pattern analysis across large spatial areas. Also called “heat maps,” these visualizations sum event and transaction data to create a raster layer with hot spots in areas with large numbers of activities. Data aggregation is defined over a certain time interval. For example, by setting a weekly time threshold and creating multiple density maps, analysts can quickly understand how patterns of activity change from week to week.
Density maps allow analysts to quickly get a sense for where (and when) activities tend to occur. This information is used in different ways depending on the analysis needs. If events are very rare like missile launches or explosions, density maps focus the analyst’s attention to these key events.
In the case of vehicle movement (tracks), density maps identify where most traffic tends to occur. This essentially identifies nondiscrete locations and may serve as a contraindicator for interesting nodes at which to exploit patterns of life. For example, in an urban environment, density maps highlight major shopping centers and crowded intersections. In a remote environment, density maps of movement data may tip analysts to interesting locations.
Other algorithms process track data to find intersections and overlaps. For example, movers with similar speed and heading in close proximity appear as cotravelers. When they are in a line, they may be considered a convoy. When two movers come within a certain proximity for a certain time, this can be characterized as a “meeting.” Mathematical relations with different time and space thresholds identify particular behaviors or compound events.
22.5 Information Sharing and Data Export
Many frameworks feature geoannotations to enhance spatial storytelling. These geospatially and temporally referenced “callout boxes” highlight key events and contain analyst-entered metadata describing a complex series of events and transactions.
Not all analysts operate within an ABI analysis tool but could benefit from the output of ABI analysis. Tracks, image chips, event markers, annotations, and other data in activity sets can be exported in KML, the standard format for Google Earth and many spatial visualization tools. KML files with temporal metadata enable the time slider within Google Earth, allowing animation and playback of the spatial story.
22.6 Summary
Over the past 10 years, several tools have emerged that use the same common core features to aid analysts in understanding large amounts of spatial and temporal data. At the 2014 USGIF GEOINT Symposium, tool vendors including BAE Systems [13, 14], Northrop Grumman [15], General Dynamics [16], Analytical Graphics [17, 18], DigitalGlobe, and Leidos [19] showcased advanced analytics tools similar to the above [20]. Georeferenced events and transactions, temporally explored and correlated with other INT sources allow analysts to exploit pattern-of-life elements to uncover new locations and relationships. These tools continue to develop as analysts find new uses for data sources and develop tradecraft for combining data in unforeseen ways.
23
Pattern Analysis of Ubiquitous Sensors
The “Internet of Things” is an emergent paradigm where sensor-enabled digital devices record and stream increasing volumes of information about the patterns of life of their wearer, operator, holder—the so-called user. We, as the users, leave a tremendous amount of “digital detritus” behind in our everyday activities. Data mining reveals patterns of life, georeferences activities, and resolves entities based on their activities and transactions. This chapter demonstrates how the principles of ABI apply to the analysis of humans, their activities, and their networks…and how these practices are employed by commercial companies against ordinary citizens for marketing and business purposes every day.
23.3 Integrating Multiple Data Sources from Ubiquitous Sensors
Most of the diverse sensor data collected by increasingly proliferated commercial sensors is never “exploited.” It is gathered and indexed “just in case” or “because it’s interesting.” When these data are combined, it illustrates the ABI principles of integration before exploitation and shows how a lot of understanding can be extracted from several data sets registered in time and space, or simply related to one another.
Emerging research in semantic trajectories describes a pattern of life as a sequence of semantic movements (e.g., “he went to the store”) as a natural language representation of large volumes of spatial data [2]. Some research seeks to cluster similar individuals based on their semantic trajectories rather than trying to correlate individual data points mathematically using correlation coefficients and spatial proximities [3].
23.4 Summary
ABI data from digital devices, including self-reported activities and transactions, are increasingly becoming a part of analysis for homeland security, law enforcement, and intelligence activities. The proliferation of such digital data will only continue. Methods and techniques to integrate large volumes of this data in real time and analyze it quickly and cogently enough to make decisions are needed to realize the benefit these data provide. This chapter illustrated visual analytic techniques for discovering patterns in this data, but emergent techniques in “big data analytics” are being used by commercial companies to automatically mine and analyze this ubiquitous sensor data at network speed and massive scale.
24
ABI Now and Into the Future
Patrick Biltgen and David Gauthier
The creation of ABI was the proverbial “canary in the coal mine” for the intelligence community. Data is coming; and it will suffocate your analysts. Compounding the problem, newer asymmetric threats can afford to operate with little to no discernable signature and traditional nation-based threats can afford to hide their signatures from our intelligence capabilities by employing expensive countermeasures. Since its introduction in the mid 2000s, ABI has grown from its roots as a method for geospatial multi-INT fusion for counterterrorism into a catch-all term for automation, advanced analytics, anticipatory analysis, pattern analysis, correlation, and intelligence integration. Each of the major intelligence agencies has adapted a spin on the technique and is pursuing tradecraft and technology programs to implement the principles of ABI.
the core tenets of ABI become increasingly important in the integrated cyber/geospace and consequent threats emerging in the not too distance future.
24.1 An Era of Increasing Change
At the 2014 IATA AVSEC World conference, DNI Clapper said, “Every year, I’ve told Congress that we’re facing the most diverse array of threats I’ve seen in all my years in the intelligence business”
On September 17, 2014, Clapper unveiled the 2014 National Intelligence Strategy (NIS)—for the first time, unclassified in its entirety—as the blueprint for IC priorities over the next four years. The NIS describes three overarching mission areas, strategic intelligence, current operations, and anticipatory intelligence, as well as four mission focus areas, cyberintelligence, counterterrorism, counterproliferation, and counterintelligence [3, p. 6]. For the first time, the cyberintelligence mission is recognized as co-equal to the traditional intelligence missions of counterproliferation and counterintelligence (as shown in Figure 24.1). The proliferation of state and non-state cyber actors and the exploitation of information technology is a dominant threat also recognized by the NIC in Global Trends 2030 [2].
Incoming NGA director Robert Cardillo said, “The nature of the adversary today is agile. It adapts. It moves and communicates in a way it didn’t before. So we must change the way we do business” [4]. ABI represents such a change. It is a fundamental shift in tradecraft and technology for intelligence integration and decision advantage that can be evolved from its counterterrorism roots to address a wider range of threats.
24.2 ABI and a Revolution in Geospatial Intelligence
The ABI revolution at NGA began with grassroots efforts in the early 2000s and evolved as increasing numbers of analysts moved from literal exploitation of images and video to nonliteral, deductive analysis of georeferenced metadata.
The importance of GEOINT to the fourth age of intelligence was underscored by the NGA’s next director, Robert Cardillo, who said “Every modern, local, regional and global challenge—climate change, future energy landscape and more—has geography at its heart”
NGA also released a vision for its analytic environment of 2020, noting that analysts in the future will need to “spend less time exploiting GEOINT primary sources and more time analyzing and understanding the activities, relationships, and patterns discovered from these sources”—implementation of the ABI tradecraft on worldwide intelligence issues.
Figure 24.4 shows the principle of data neutrality in the form of “normalized data services” and highlights the role for “normalcy baselines, activity models, and pattern-of-life analysis” as described in Chapters 14 and 15. OBP, as shown in the center of Figure 24.4, depicts a hierarchical model, perhaps using the graph analytic concepts of Chapter 15 and a nonlinear analytic process that captures knowledge to form judgments and answer intelligence questions. Chapter 16’s concept of models is shown in Figure 24.4 as “normalcy baselines, activity models, and pattern-of-life analysis.” As opposed to the traditional intelligence process that focuses on the delivery of serialized products, the output of the combined ABI/OBP process is an improved understanding of activities and networks.
Sapp also described the operational success story of the Fusion Analysis & Development Effort (FADE) and the Multi-Intelligence Spatial Temporal Tool-suite (MIST), which became operational in 2007 when NRO users recognized that they got more information out of spatiotemporal data when it was animated. NRO designed a “set of tools that help analysts find patterns in large quantities of data” [15]. MIST allows users to temporally and geospatially render millions of data elements, animate them, correlate multiple sources, and share linkages between data using web-based tools. “FADE is used by the Intelligence Community, Department of Defense, and the Department of Homeland Security as an integral part of intelligence cells” [17]. An integrated ABI/multi-INT framework is a core component of the NRO’s future ground architecture [18].
24.5 The Future of ABI in the Intelligence Community
In 1987, the television show Star Trek: The Next Generation, set in the 24th century, introduced the concept of the “communicator badge,” a multifunctional device worn on the right breast of the uniform. The badge represented an organizational identifier, geolocator, health monitoring system, environment sensor, tracker, universal translator, and communications device combined into a 4 cm by 5 cm package.
In megacities, tens of thousands of entities may occupy a single building, and thousands may move in and out of a single city block in a single day. The flow of objects and information in and out of the control volume of these buildings may be the only way to collect meaningful intelligence on humans and their networks because traditional remote sensing modalities will have insufficient resolution to disambiguate entities and their activities. Entity resolution will require thorough analysis of multiple proxies and their interaction with other entity proxies, especially in cases where significant operational security is employed. Absence of a signature of any kind in the digital storm will itself highlight entities of interest. Everything happens somewhere, but if nothing happens somewhere that is a tip to a discrete location of interest.
The methods described in this textbook will become increasingly core to the art of analysis. The customer service industry is already adopting these techniques to provide extreme personalization based upon personal identity and location. Connected data from everyday items networked via the Internet will enable hyperefficient flow of physical materials such as food, energy, and people inside complex geographic distribution systems. Business systems that are created to enable this hyperefficiency, often described as “smart grids” and the “Internet of Things”, will generate massive quantities of transaction data. This data, considered nontraditional by the intelligence community, will become a resource for analytic methods such as ABI to disambiguate serious threats from benign activities.
24.6 Conclusion
The Intelligence Community of 2030 will be entirely comprised of digital natives born after 9/11 who seamlessly and comfortably navigate a complex data landscape that blurs the distinctions between geospace and cyberspace. The topics in this book will be taught in elementary school.
Our adversaries will have attended the same schools, and counter-ABI methods will be needed to deter, deny, and deceive adversaries who will use our digital dependence against us. Devices—those Internet-enabled self-aware transportation and communications technologies—will increasingly behave like humans. Even your washing machine will betray your pattern of life. LAUNDRY-INT will reveal your activities and transactions…where you’ve been and what you’ve done and when you’ve done it because each molecule of dirt is a proxy for someone or somewhere. Your clothes will know what they are doing, and they’ll even know when they are about to be put on.
In the not too distant future, the boundaries between CYBERINT, SIGINT, and HUMINT will blur, but the rich spatiotemporal canvas of GEOINT will still form the ubiquitous foundation upon which all sources of data are integrated.
25
Conclusion
In many disciplines in the early 21st century, a battle rages between traditionalists and revolutionaries. The latter is often comprised of those artists with an intuitive feel for the business. The latter is comprised of the data scientists and analysts who seek to reduce all of human existence to facts, figures, equations, and algorithms.
Activity-Based Intelligence: Principles and Applications introduces methods and technologies for an emergent field but also introduces a similar dichotomy between analysts and engineers. The authors, one of each, learned to appreciate that the story of ABI is not one of victory for either side. In The Signal and the Noise, statistician and analyst Nate Silver notes that in the case of Moneyball, the story of scouts versus statisticians was about learning how to blend two approaches to a difficult problem. Cultural differences between the groups are a great challenge to collaboration and forward progress, but the differing perspectives are also a great strength. In ABI, there is room for both the art and the science; in fact, both are required to solve the hardest problems in a new age of intelligence.
Intelligence analysts in some ways resemble Silver’s scouts. “We can’t explain how we know, but we know” is a phrase that would easily cross the lips of many an intelligence analyst. At times, analysts even have difficulty articulating post hoc the complete reasoning that led to a particular conclusion. This, undeniably, is a very human part of nature. In an incredibly difficult profession, fraught with deliberate attempts to deceive and confuse, analysts are trained from their first day on the job to trust their judgment. It is judgment that is oftentimes unscientific, despite attempts to apply structured analytic techniques (Heuer) or introduce Bayesian thinking (Silver). Complicating this picture is the fissure in the GEOINT analysis profession itself, between traditionalists often focused purely on overhead satellite imagery and revolutionaries, analysts concerned with all spatially referenced data. In both camps, however, intelligence analysis is about making judgments. Despite all the automated tools and algorithms used to process increasingly grotesque amounts of data, at the end of the day a single question falls to a single analyst: “What is your judgment?”
The ABI framework introduces three key principles of the artist frequently criticized by the engineer. First, it seems too simple to look at data in a spatial environment and learn something, but the analysts learned through experience that often the only common metadata is time and location—a great place to start. The second is the preference of correlation over causality. Stories of intelligence are not complete stories with a defined beginning, middle, and end. A causal chain is not needed if correlation focuses analysis and subsequent collection on a key area of interest or the missing clue of a great mystery. The third oft-debated point is the near-obsessive focus on the entity. Concepts like entity resolution, proxies, and incidental collection focus analysts on “getting to who.” This is familiar to leadership analysts, who have for many years focused on high-level personality profiles and psychological analyses. But unlike the focus of leadership analysis—understanding mindset and intent—ABI focuses instead on the most granular level of people problems: people’s behavior, whether those people are tank drivers, terrorists, or ordinary citizens. Through a detailed understanding of people’s movement in space-time, abductive reasoning unlocked possibilities as to the identity and intent of those same people. Ultimately, getting to who gets to the next step—sometimes “why,” sometimes “what’s next.”
Techniques like automated activity extraction, tracking, and data fusion help analysts wade through large, unwieldy data sets. While these techniques are sometimes synonymized with “ABI” or called “ABI enablers,” they are more appropriately termed “ABI enhancers.” There are no examples of such technologies solving intelligence problems entirely absent the analyst’s touch.
The engineer’s world is filled with gold-plated automated analytics and masterfully articulated rule sets for tipping and cueing, but it also comes with a caution. In Silver’s “sabermetrics,” baseball presents possibly the world’s richest data set, a wonderfully refined, well-documented, and above all complete set of data from which to draw conclusions. In baseball, the subjects of data collection do not attempt to deliberately hide their actions or prevent data from being collected on them. The world of intelligence, however, is very different. Intelligence services attempt to gather information on near-peer state adversaries, terrorist organizations, hacker collectives, and many others, all of whom make deliberate, concerted attempts to minimize their data footprint. In the world of state-focused intelligence this is referred to as D&D; in entity-focused intelligence this is called OPSEC. The data is dirty, deceptive, and incomplete. Algorithms alone cannot make sense of this data, crippled by unbounded uncertainty; they need human judgment to achieve their full potential.
NGA director Robert Cardillo, speaking at to the Intelligence & National Security Alliance (INSA) in January 2015, stated “TCPED is dead.” He went on to state that he was not sure if there would be a single acronym to replace it. “ABI, SOM, and [OBP]
— what we call the new way of thinking isn’t important. Changing the mindset is,” Cardillo stated. This acknowledgement properly placed ABI as one of a handful of new approaches in intelligence, with a specific methodology, specific technological needs, and a specific domain for application. Other methodologies will undoubtedly emerge in the efforts of modern intelligence services to adapt to a continually changing and ever more complicated world, which will complement and perhaps one day supplant ABI.
This book provides a deep exposition of the core methods of ABI and a broad survey of ABI enhancers that extend far beyond ABI methods alone. Understanding these principles will ultimately serve to make intelligence analysts more effective at their single goal: delivering information to aid policymakers and warfighters in making complex decisions in an uncertain world.